Bollinger Bands: Determining Volatility Correctly
John Bollinger introduced to the community the indicator of the same name for asset analysis in the 90s. The method quickly became popular and is now used by traders around the world.
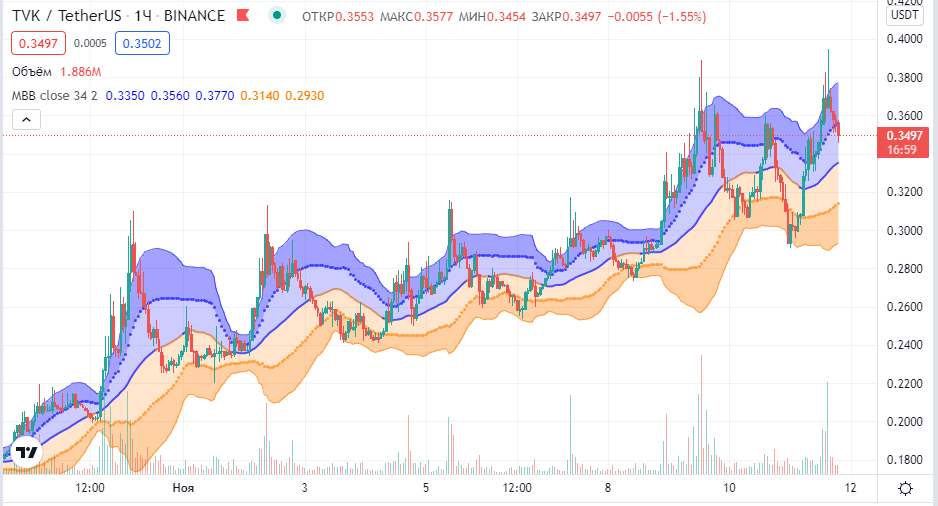
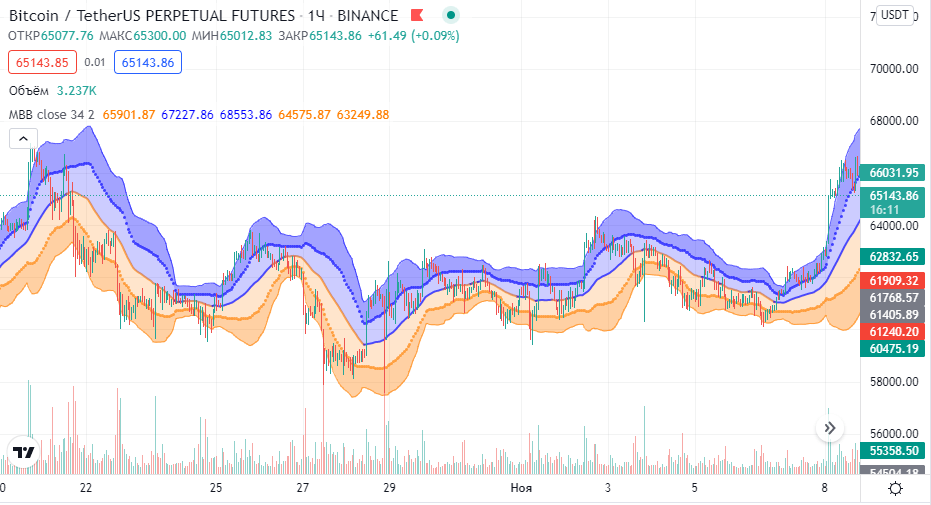
The idea behind Bollinger Bands is to combine a trend, volatility, and an oscillator. The bands show the range of fluctuations in quotes typical for the current trend movement. The method uses three types of lines: a moving average in the middle (shows the main movement of the chart) and a pair of lines that determine the min and max of the asset value. Therefore, it is easy to determine the state of a financial instrument (overbought or oversold) by using Bollinger bands.
The indicator has the following features:
•If the area between min and max narrows, this indicates a probable trend reversal, if they diverge, the current movement remains;
•The direction of the trend is determined relative to the moving average. If the trend is higher, then the movement is upward;
•The movement of one border is likely to trigger the second.
Bollinger Bands are easy to use for:
•Recognition of double bottoms and tops;
•Opening/closing orders after rollbacks;
•Determining a sharp change in prices (the bands are narrowing).
Today, John Bollinger owns a company that uses the methods of the founder in his professional activities.