Elliott Waves in Trading: How to Use Them
Contents
- Introduction
- General Description of Elliott Wave Theory
- The Importance of Understanding Wave Theory for Traders, Especially in Crypto Trading
- Basics of the Elliott Wave Theory
- Rules and Principles of Elliott Waves
- How to Apply Elliott Waves in Crypto Trading
- Example of Using Elliott Waves on a Chart
- Mistakes and Difficulties in Using Elliott Wave Theory
- Conclusion
Introduction
Markets are constantly moving. Sometimes the price rises, sometimes it falls, and sometimes it stays still. Traders need to understand why this happens. One way to grasp price behavior is the Elliott Wave Theory. This method helps identify the current state of the market and anticipate future developments. It has gained particular popularity among those who trade in volatile markets, such as cryptocurrency.
General Description of Elliott Wave Theory
Elliott Wave Theory is a method of analyzing price movements. It is based on the idea that the market develops according to specific recurring patterns, called waves. According to Elliott, price movement is not random. It depends on human behavior, emotions, and expectations. When most people think alike, this creates consistent price movements that form the waves.
The Importance of Understanding Wave Theory for Traders, Especially in Crypto Trading
The cryptocurrency market often behaves sharply and unpredictably. But some traders believe that even in chaos, there are patterns. Elliott Waves help them find these patterns. With this theory, one can understand when a trend is continuing and is close to ending. This helps make more accurate decisions: when to enter a trade, when to exit, and when to observe simply. For a crypto trader, this is especially important, as market moves can be swift and decisive.
Basics of the Elliott Wave Theory
History and Creation of the Theory
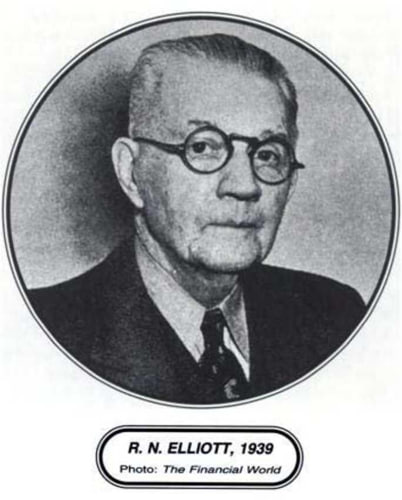
Ralph Nelson Elliott developed the theory in the 1930s. He noticed that price movements in the stock market repeated over time. These repetitions were not random. They followed specific rules. Elliott spent many years studying charts to identify clear patterns. Eventually, he concluded that the market moves in waves that reflect crowd sentiment, from optimism to fear.
Theory Principles: Five Waves in the Trend Direction and Three in Correction
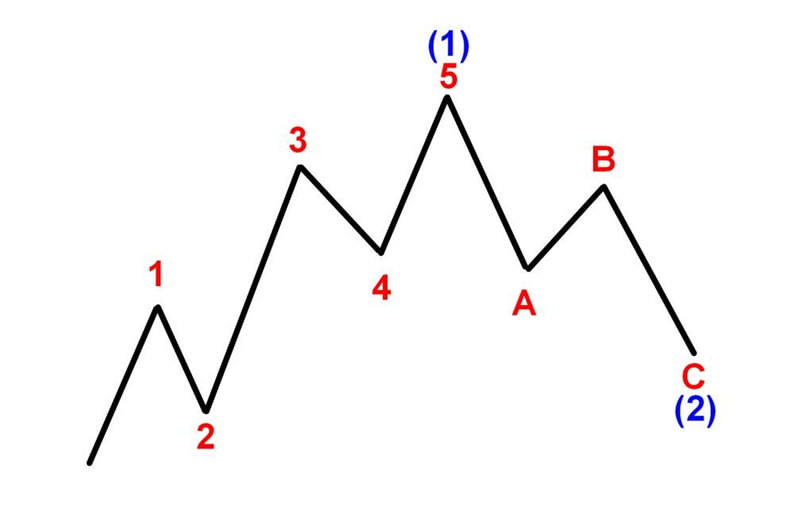
The theory’s core lies in alternating two types of movement: the primary trend (1) and the correction (2). The primary trend consists of five waves, usually labeled with numbers: 1, 2, 3, 4, 5. This means that price moves in one direction in five steps: three upward (if the trend is bullish) and two downward. After that, a correction begins, which consists of three waves labeled A, B, and C: two waves against the trend and one in the trend direction.
The five waves are called the impulse part, and the three are the correction. Together, they form one complete cycle. Then a new cycle begins, following the same principle.
Main Types of Waves: Impulse and Corrective
Waves are divided into two types. Impulse waves move in the direction of the primary trend. These are usually the first, third, and fifth waves. These waves are strong and energetic. They indicate that most market participants are confident in the price movement.
Corrective waves move against the trend. These are the second and fourth waves within the impulse and all three waves of the correction. These movements are more complex and often confusing. During this time, the market pauses before the next decisive move.
Rules and Principles of Elliott Waves
Rules for Waves 1, 3, 5, 2, and 4
Each wave within the impulse must follow specific rules:
-
Wave 2 cannot fall below the start of Wave 1.
-
Wave 3 cannot be the shortest among Waves 1, 3, and 5.
-
Wave 4 cannot enter the area where Wave 1 was.
If any of these rules are broken, the structure is not an Elliott wave, and a different pattern should be identified on the chart.
Features of Wave Ratios (e.g., Wave 3 Cannot Be the Shortest)
It is essential to understand how waves relate to each other. For example, the third wave is almost always the longest and strongest. If it is short, that signals the structure is likely incorrect. There are also common numerical ratios between wave lengths. For instance, Wave 3 is often 1.618 times the length of Wave 1—this is the so-called “golden ratio.” These proportions help not only to determine which wave the market is currently in, but also to anticipate where the price may move next.
Principles of Relativity and Their Significance
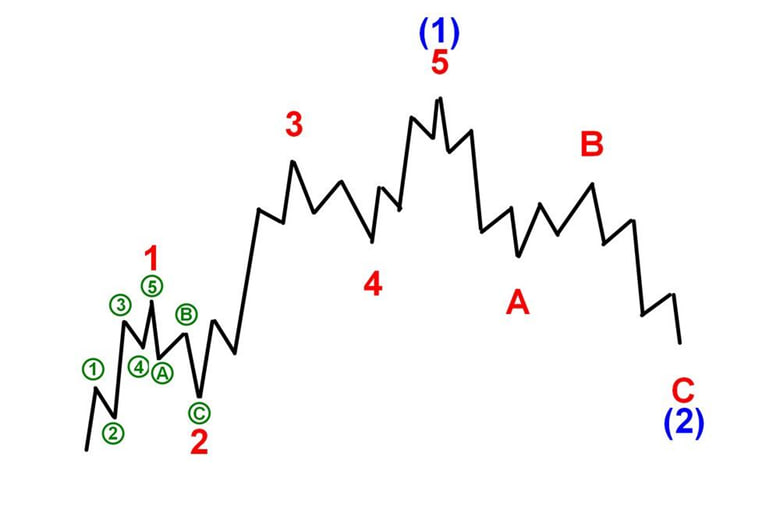
The principle of relativity in wave theory means that waves of one degree can be part of waves of a higher degree. For example, five small waves can form one large impulse wave. This helps analyze the market across different time frames—from minute charts to monthly ones. Understanding this principle gives the trader a complete view of the market, instead of focusing on short-term movements.
How to Apply Elliott Waves in Crypto Trading
Why the Elliott Wave Theory Is Effective for the Cryptocurrency Market
The crypto market often moves sharply. The price can rise within a few hours and fall just as fast. This happens because the market includes many traders with varying emotions. Some fear missing out on profit, while others fear losing money. Elliott Waves are based precisely on emotions. That’s why this theory is believed to work well in cryptocurrencies. It helps to understand the market’s current growth, decline, or correction phase. This gives traders an edge, especially those who trade actively.
Specifics of the Cryptocurrency Market
The crypto market differs from traditional markets. It is more volatile—prices can move significantly even without strong reasons. News often causes sharp spikes. For example, a tweet by Elon Musk or a regulator’s statement can change the price within minutes. In addition, the crypto market has many newcomers. They often make emotional trades. All this makes price behavior less stable, but suitable for wave analysis. Waves on charts form faster and are more visible than, say, in the stock market.
Tips for Using Elliott Waves to Analyze Cryptocurrencies
- Start with larger time frames. It’s better to begin with daily and 4-hour charts. Waves are more visible there. Then you can move to 1-hour and smaller charts.
- Identify the primary trend. Determine the overall market direction—up or down. This will help you understand whether you are looking at impulse or corrective waves.
- Look for five consecutive waves. If you see five precise movements in one direction on the chart, it’s likely an impulse. After that, expect three waves in the opposite direction—a correction.
- Don’t rush. It’s better to wait for the waves to form fully than to guess. If you’re unsure, it’s better not to enter a trade.
- Use Fibonacci levels. They help identify where a wave might end. This is especially useful for finding entry or exit points.
The Importance of Combining Waves with Other Technical Analysis Tools
Elliott Waves are not a magic formula. Sometimes they work clearly, and sometimes they don’t. So it’s best not to rely on waves alone. It’s wise to use them along with other tools. For example:
-
Support and resistance levels — show where the price may stop or reverse.
-
Volume indicators — help determine the strength of a movement.
-
Trend lines and channels — clarify the direction of movement.
-
Oscillators (e.g., RSI or MACD) — show when the market is overheated.
When these tools confirm the wave structure, the signal becomes stronger. This helps make more confident decisions.
Example of Using Elliott Waves on a Chart
Step-by-Step Explanation Using Litecoin as an Example
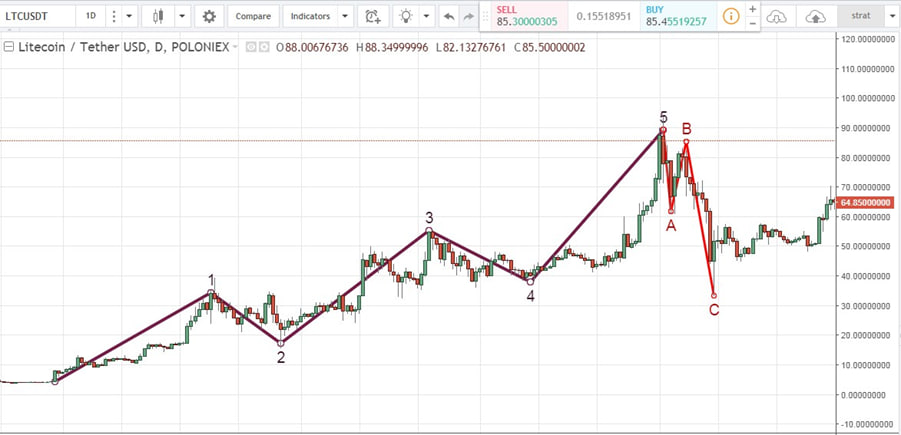
We have a daily chart of the LTC/USDT pair. The price followed a classic five-wave impulse structure upwards:
-
Wave 1 — the initial rise.
-
Wave 2 — correction after the first move up.
-
Wave 3 — strong upward impulse.
-
Wave 4 — moderate pullback.
-
Wave 5 — final surge, completing the impulse phase.
After Wave 5, a corrective A-B-C structure began:
-
Wave A — sharp decline.
-
Wave B — short-term rebound upward.
-
Wave C — continued drop, completing the correction.
This pattern often signals a correction’s end and a new impulse’s potential start. After Wave C finishes, it may be time to look for long entry points.
Mistakes and Difficulties in Using Elliott Wave Theory
Difficulties in Identifying Start and End Points of Waves
The most common mistake is incorrect labeling. Sometimes a trader sees a wave where there is none. Or they mistake the beginning, for example, treating a pullback as the start of an impulse. As a result, the structure will be incorrect. Waves can intertwine and overlap. So it takes time to learn to identify them correctly. Whether a wave has ended or is part of a more significant wave is unclear. Here, observation and experience are essential.
-
Don’t rush. Wait until the wave has fully formed. Entering too early can lead to traps.
-
Use multiple time frames. Sometimes, a wave looks like a correction on one chart but is like an impulse on another.
-
Use confirmations. Don’t rely on waves alone. Confirm signals with other methods.
-
Practice with historical charts. Mark up past price action. This will help you spot structures more quickly in real time.
The Importance of Consistent Practice and Experience
To use Elliott Waves effectively, one must practice. The theory seems simple, but in reality, it requires attention to detail. The more you practice, the more accurate your analysis becomes. Over time, you’ll start spotting patterns faster. You’ll understand which waves are reliable and which are not. Experience comes with practice, and that’s the best way to improve your skills.
Conclusion
Elliott Waves are a powerful tool in a trader’s hands, especially in the crypto market, where movements are often chaotic. The theory helps find order in that chaos and understand where the price may go next. The key is not to rush, to learn, verify your ideas, and not forget about other analysis tools. Over time, wave analysis will become a valuable assistant in your trading.