How to use the cumulative delta graph correctly
Delta is the difference between opening and closing orders in the market. Accordingly, a cumulative delta is a financial instrument that adds delta readings over time, depending on the selected timeframe.
The indicator has a couple of settings:
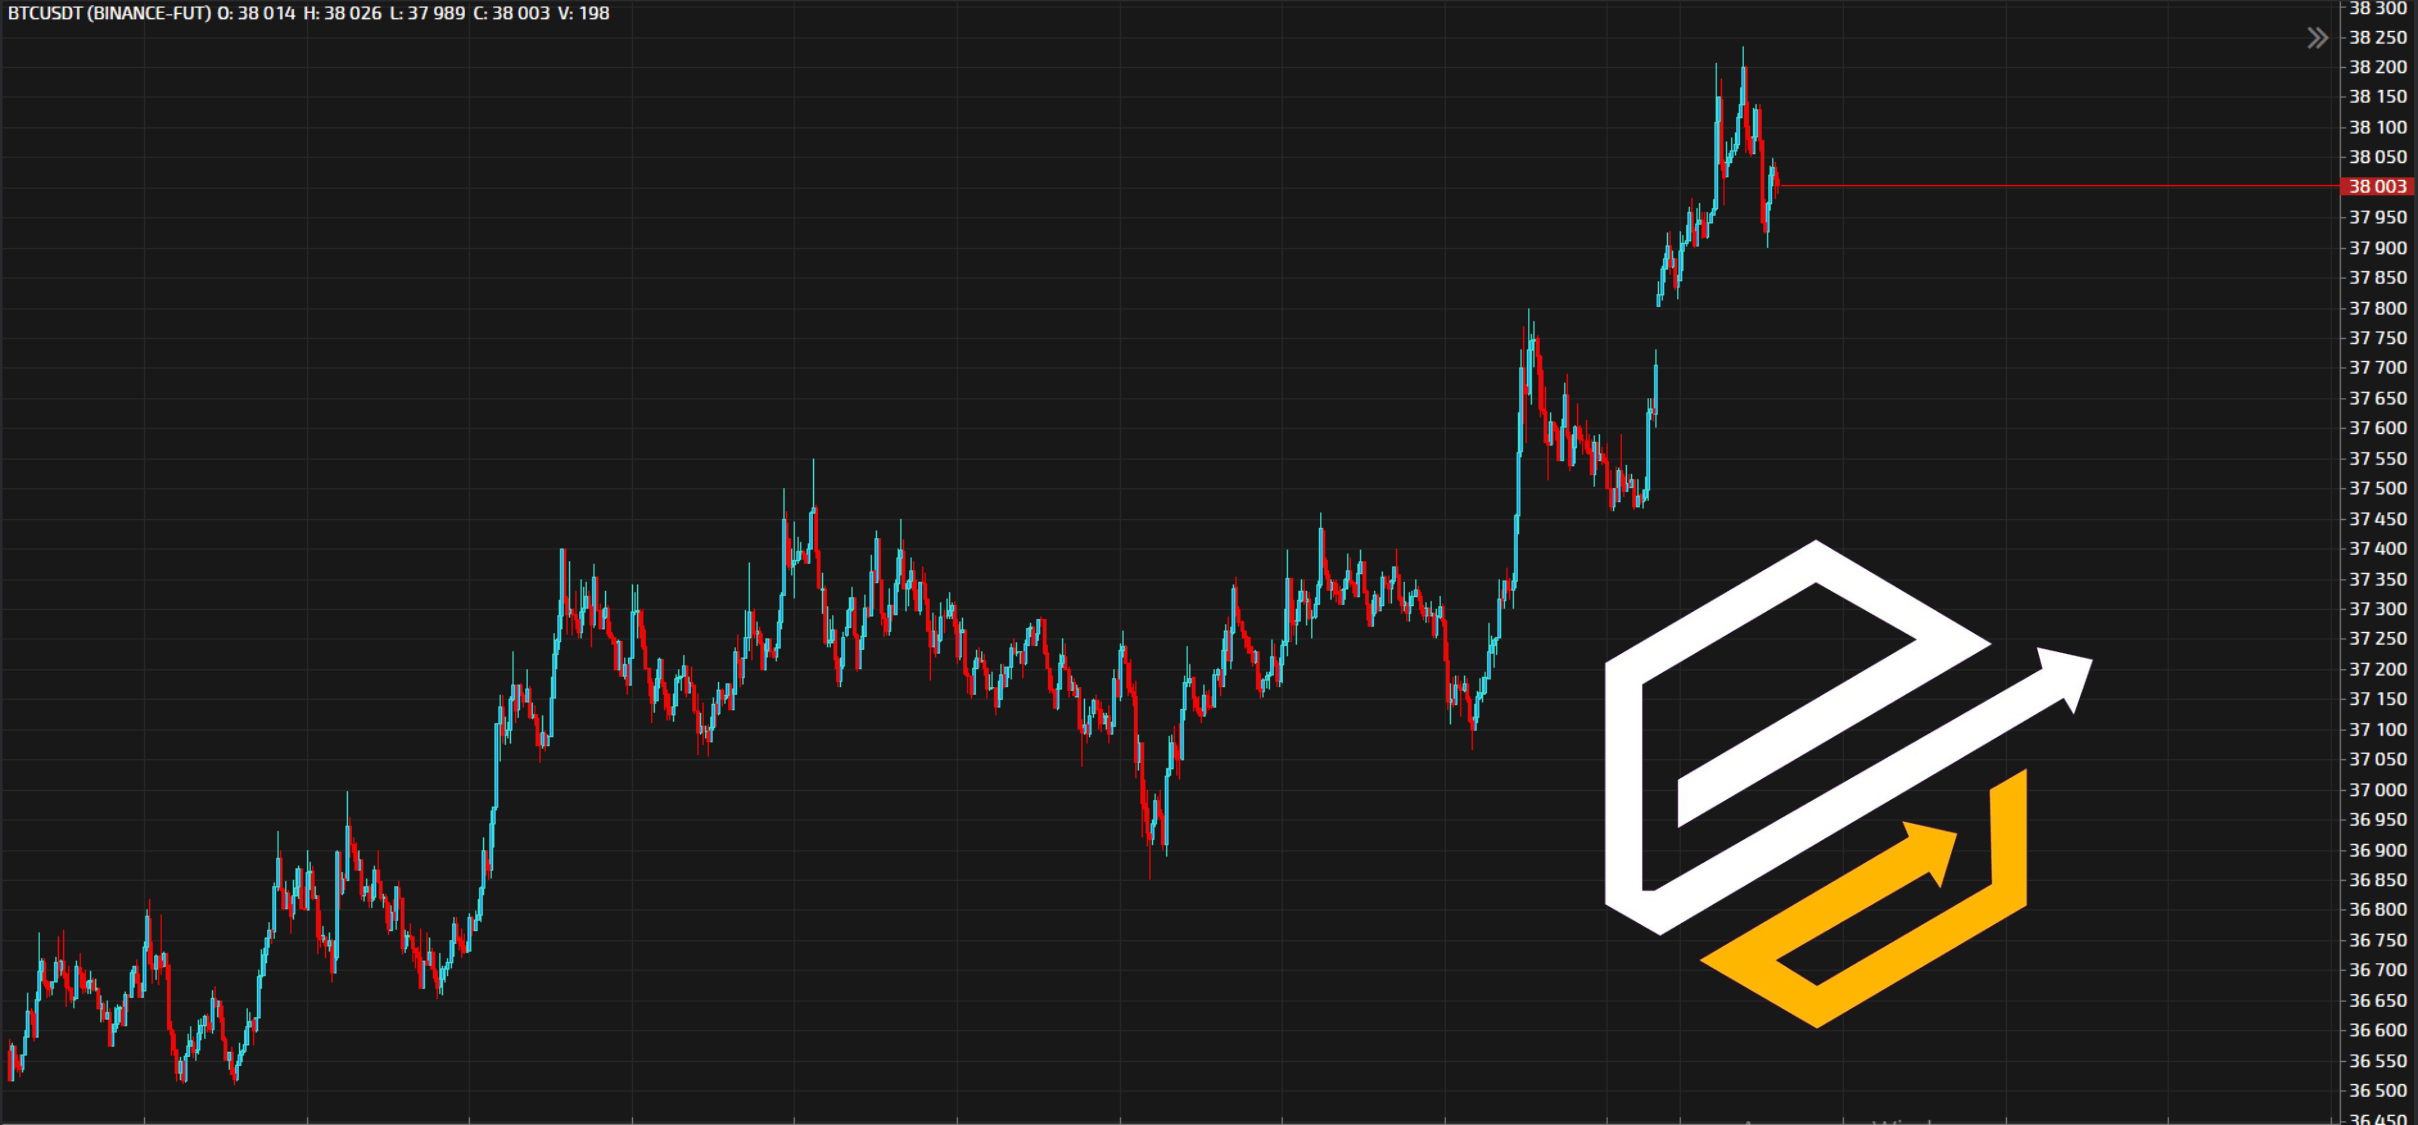
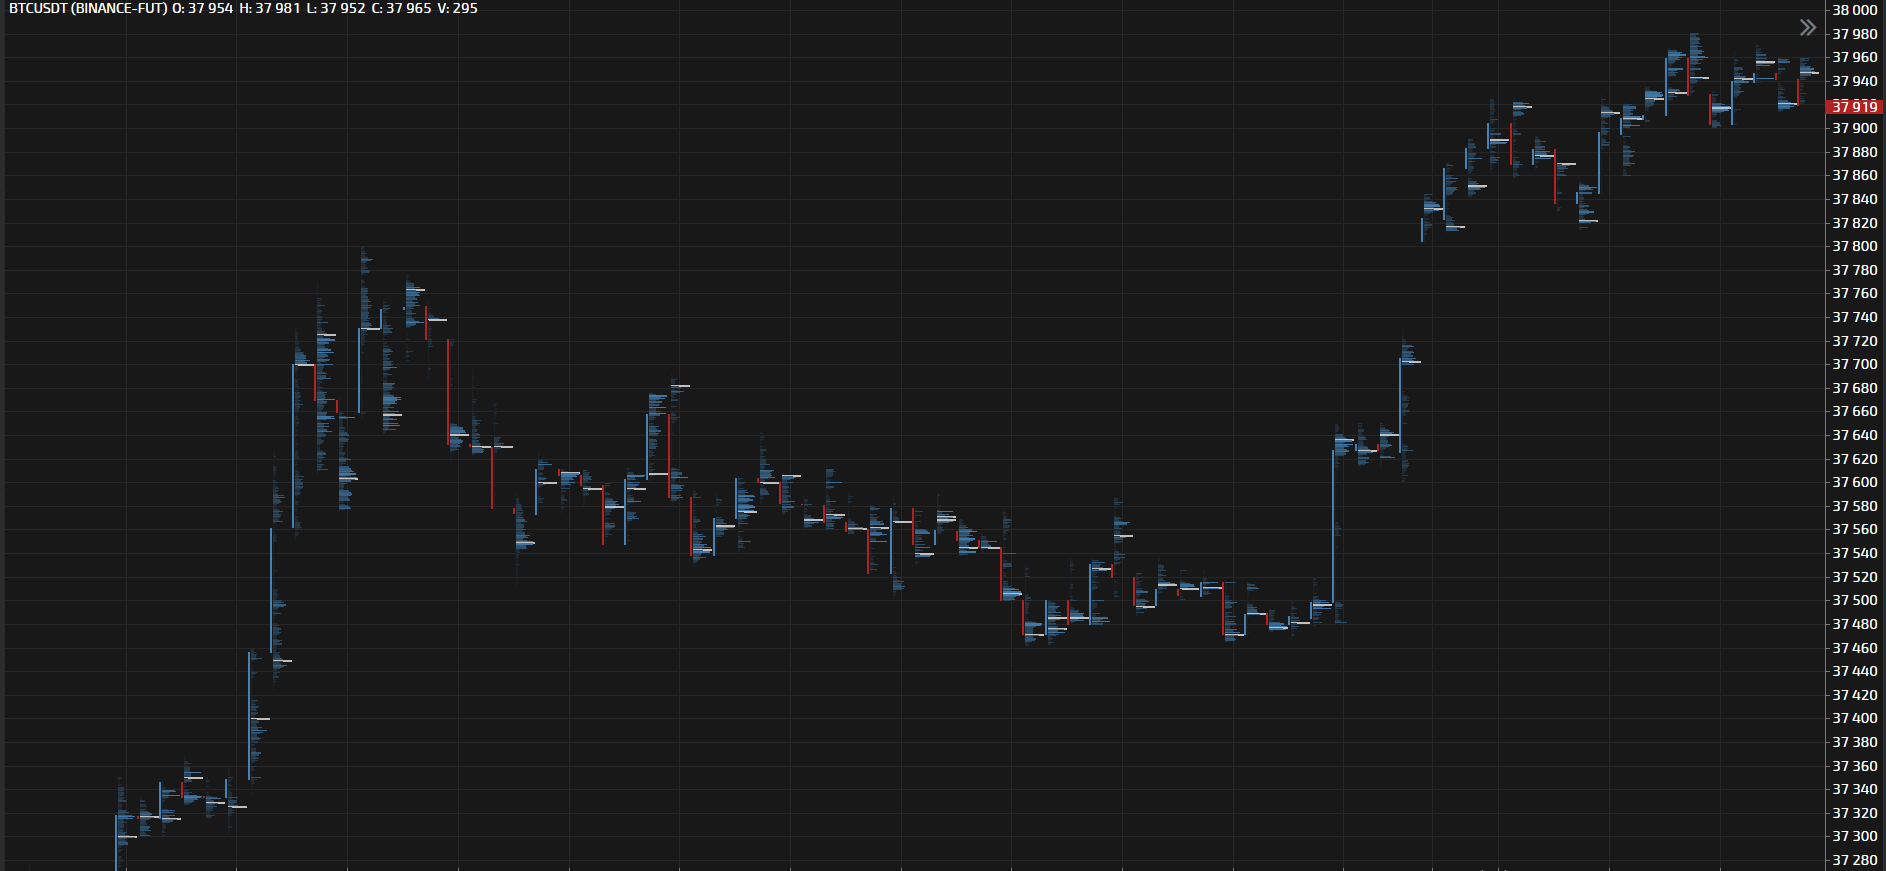
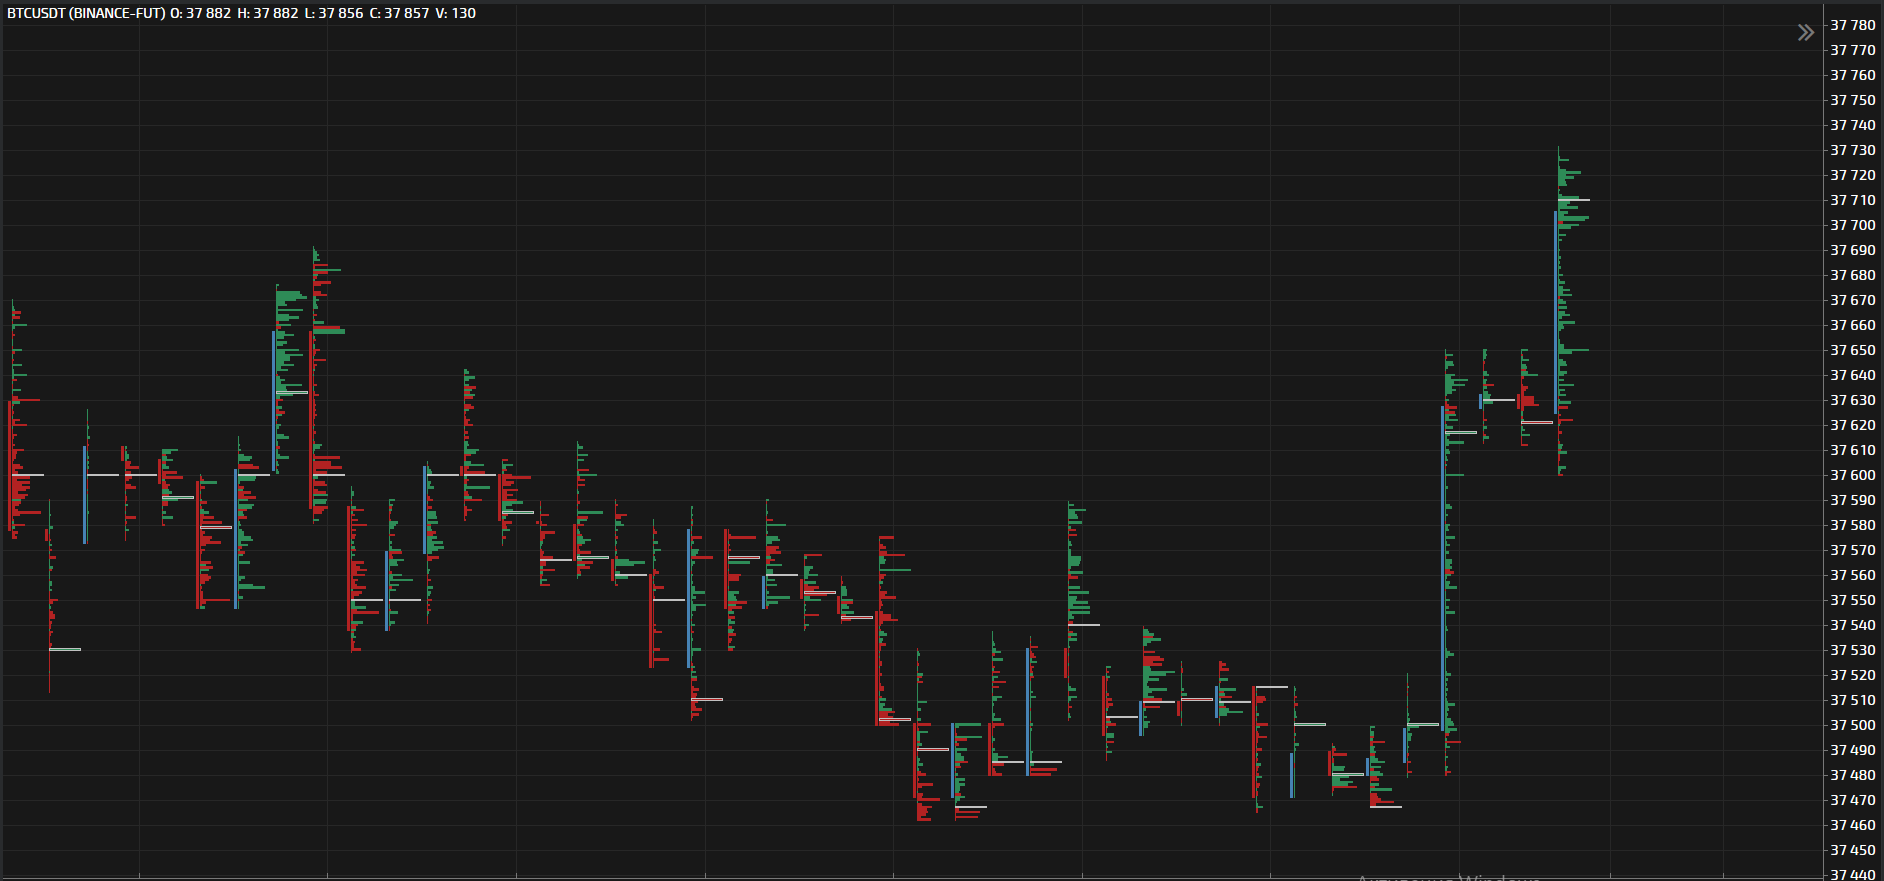
- Indication model – it can be candles, bars, or lines;
- Session Delta Mode – if the checkbox is activated, the algorithm automatically deletes all data after the start of a new trading session. If not, the indicator takes into account all the information that is on the charts.
If everything is clear with this so far, let’s talk about the strengths and weaknesses of the cumulative delta.
Benefits
The indicator works directly with the trading process, as it captures real exchange transactions. Analysis of indicators will show:
- The mood of market participants;
- The activity of bulls and bears;
- The behavior of quotes.
The behavior of quotes.
The only drawback is that there are no simple signals here, and this is not a magic wand for finding profitable entry and exit points. Therefore, an investor should practice test systems to learn how to correctly analyze and interpret trend indicators.
How to use
If the dynamics of the indicator are positive, this indicates the dominance of buyers. This is an indicator that determines the steady growth of quotations. That is, the cumulative delta is used to confirm an uptrend or downtrend forecast.
You can also use the principle of divergence. It consists of the fact that the selling pressure puts pressure on the trend, but the value continues to be stable. Therefore, we do not need short, but long in this situation.
When the head of the cumulative delta rises, it indicates that an aggressive buyer has entered the market.
This is how you can determine the direction of the trend, entry points, activity, and behavioral characteristics of investors in the market.