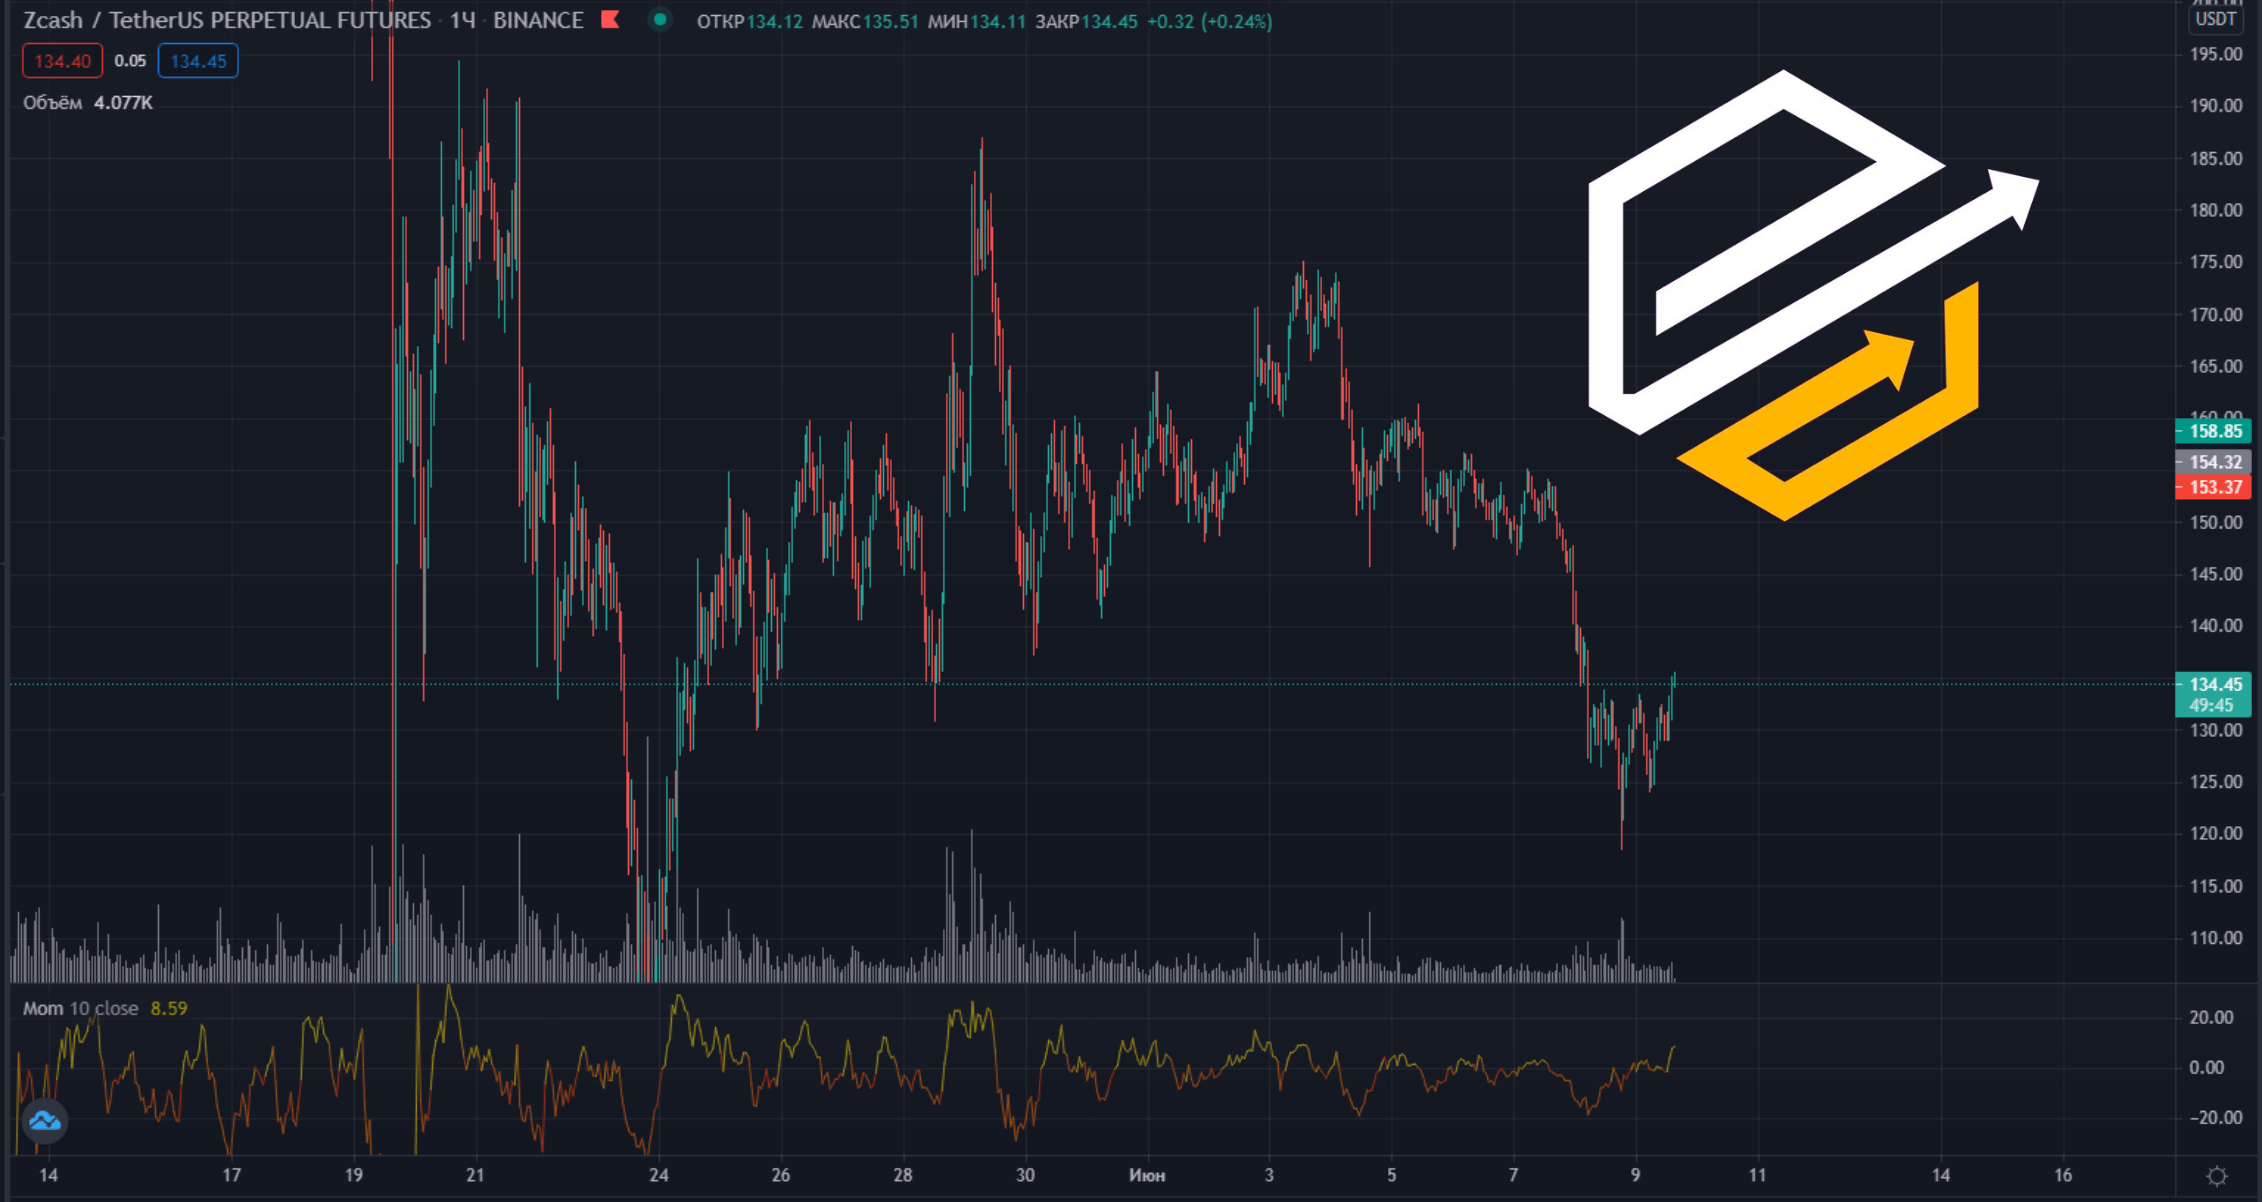
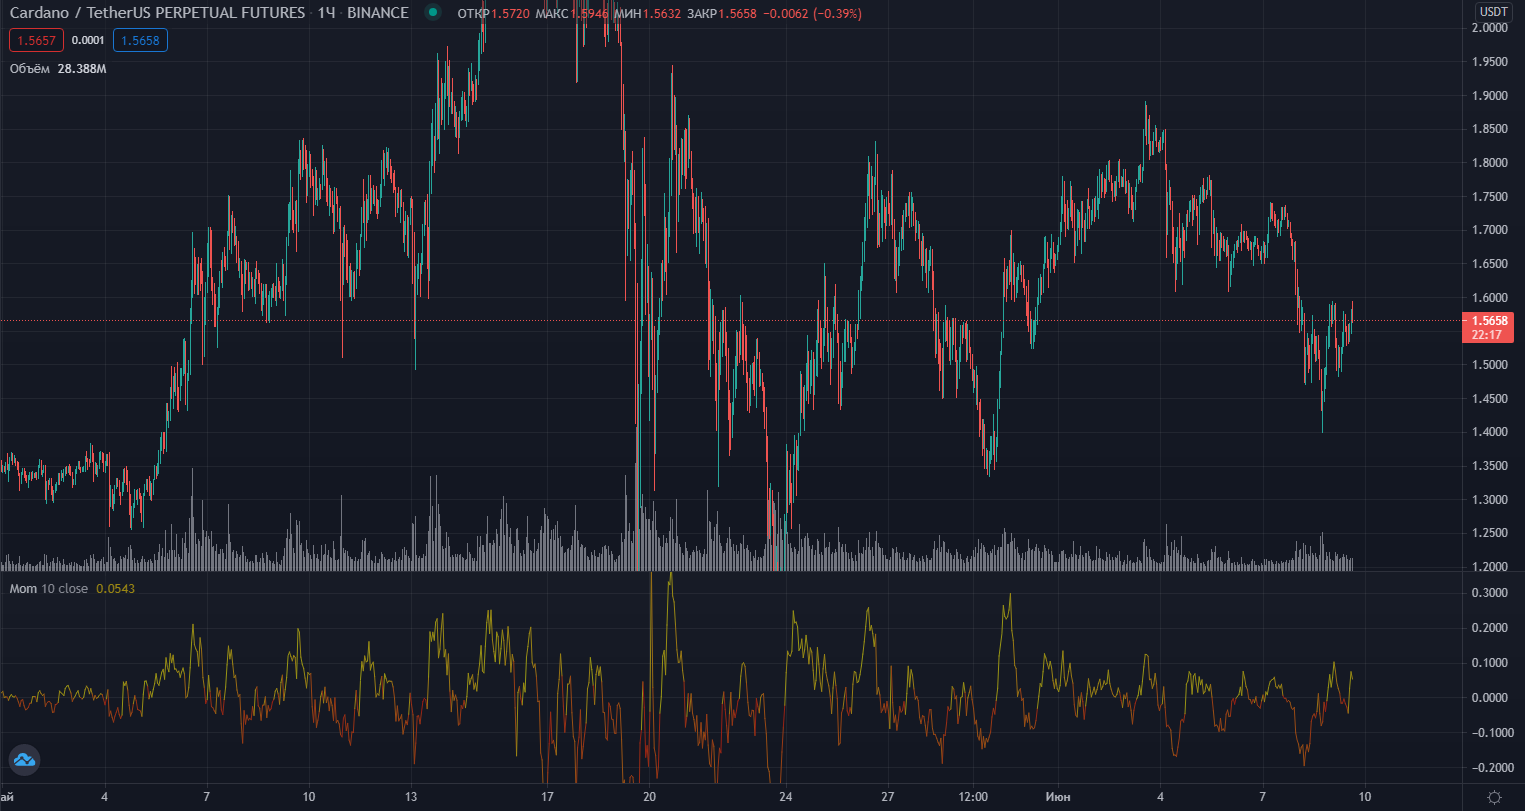
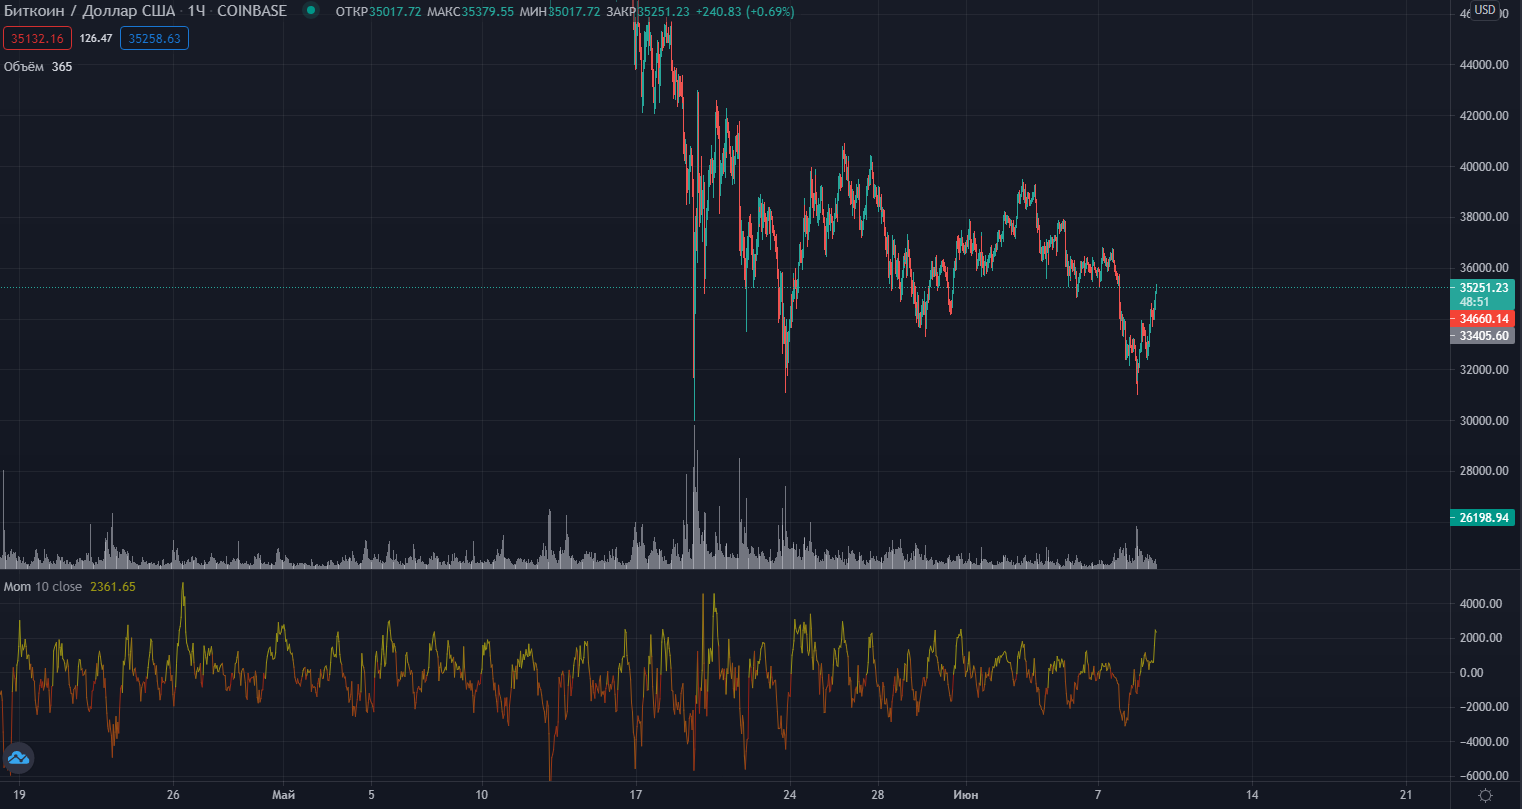
Momentum indicator

Momentum is an effective and simple pace indicator that generates leading signals of price action changes. Many people attribute it to a group of oscillators, but this is not entirely true. It can be used both as an oscillator and as a trend indicator. In the first case, a buy signal is the start of growth after a significant decline. Accordingly, the sale is made after the curve opens down after a long rally.

Momentum is a curve that fluctuates in the range from -150 to 150. Thus, by focusing on the indicator, we can predict when the next price action will take place and respond on time to its market reversal. The effectiveness of the indicator increases significantly when used in conjunction with a moving average.
The indicator is perhaps the simplest and most understandable of all trend indicators. To find out that a child is growing fast enough, you can measure his or her height each month and compare it to six months ago. Then you will know if your child is growing normally, falling behind enough to be taken to the doctor, or growing so much that you need to think about a basketball coach. Momentum tells you if the trend is accelerating or decelerating.

According to the Momentum indicator, it is quite possible to trade from overbought/oversold levels, but a problem arises – there are no clear boundaries, this line does not. We’ll have to determine additionally. For these purposes, it is useful to combine it with the Bollinger Bands channel indicator, which can show interesting areas for making deals.
The main indicators of the indicator from the point of view of a fundamental market theory are based on the idea that the market must first “slow down” before it changes, that is, movement along the current trend slows down. Momentum is one of the first to give such a signal. He is recognized as the most