On-Chain Analytics for Beginners: How to Read Data from Glassnode, Nansen, and Dune

Contents
- Introduction
- What Is On-Chain Analytics
- How to Use Glassnode for Crypto Market Analysis
- How to Read Data in Nansen
- Basics of Working with Dune Analytics
- Advantages and Limitations of On-Chain Analytics
- The Future and Prospects of On-Chain Analytics
- Conclusion
Introduction
On-chain analytics is the analysis of data recorded directly on the blockchain. Unlike traditional technical chart analysis or fundamental project evaluation, this approach provides direct insights into market participants’ behavior.
For traders and investors, it becomes a tool to improve decision-making accuracy. For beginners, it is important to master the basic metrics to see not only the price, but also the processes behind it.
What Is On-Chain Analytics

On-chain analytics in cryptocurrencies is a method of studying transactions, wallets, and user activity on the blockchain. Unlike classical analysis methods, it relies on actual network data rather than forecasts. This approach allows you to:
-
See the real number of active users
-
Track liquidity movement between exchanges
-
Study token distribution among holders
-
Assess the transparency of DeFi protocols
With this approach, the blockchain becomes a source of objective information available to anyone who knows how to read and interpret it.
Key On-Chain Metrics
Metrics help evaluate market sentiment and identify early signals of trend changes. For beginners, it’s important to focus on the key indicators:
-
Active addresses — the number of participants conducting transactions.
-
Transaction volume — movement of funds within the network.
-
Exchange inflows and outflows — an indicator of price pressure.
-
Number of token holders — a measure of asset distribution.
-
Large wallet activity — a clue about institutional investors’ actions.
Together, these parameters form the foundation for understanding what is happening with an asset in real time.
How to Use Glassnode for Crypto Market Analysis
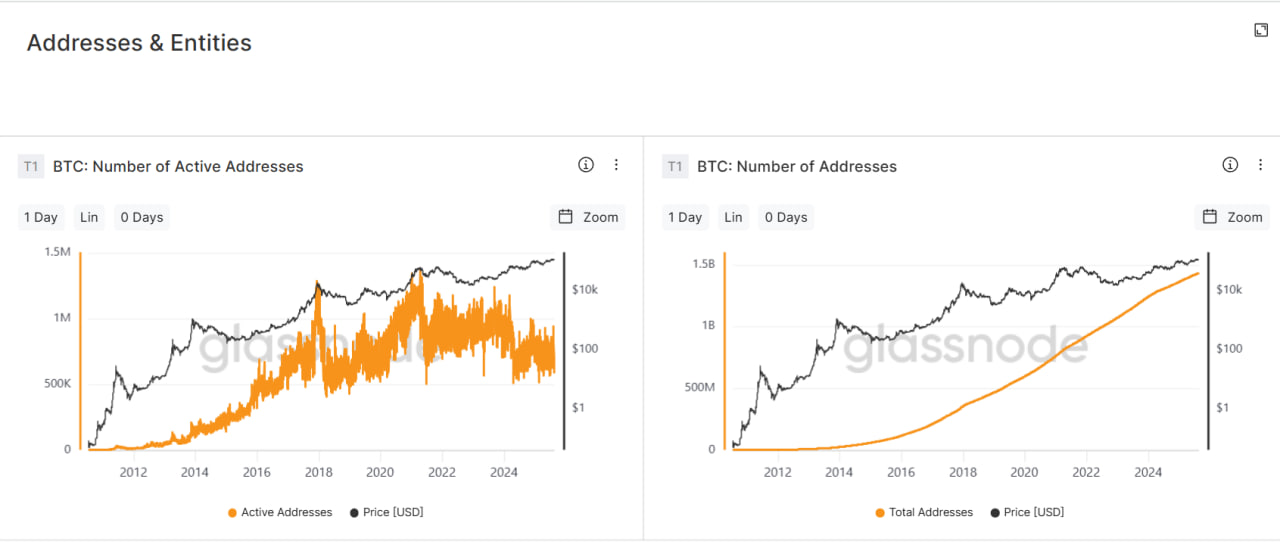
Glassnode is considered one of the leading platforms for on-chain data. The service offers a broad library of metrics, from basic to advanced. For beginners, dashboards are useful as they present data in charts and indicators.
Advantages of Glassnode:
-
User-friendly interface with visualizations
-
Basic metrics available for free
-
Detailed reports for professionals
-
Support for popular networks (BTC, ETH, etc.)
Examples of Useful Glassnode Metrics
Some indicators on this platform have become standards in on-chain analytics. Key ones include:
| Metric | What It Shows | Why It’s Useful |
|---|---|---|
| Exchange inflows/outflows | Fund flows to and from exchanges | Assess selling pressure or accumulation |
| MVRV ratio | Market value vs. realized value | Indicator of overvaluation or undervaluation |
| Active addresses | Number of active network users | Signal of ecosystem activity |
| Realized cap | Reflects the actual value of held coins, considering their last transaction price | Helps gauge how much market participants are in profit/loss, and whether capitalization is inflated |
Interpreting this data helps understand participants’ sentiment and interest, as well as when the market is overheated or has growth potential.
How to Read Data in Nansen
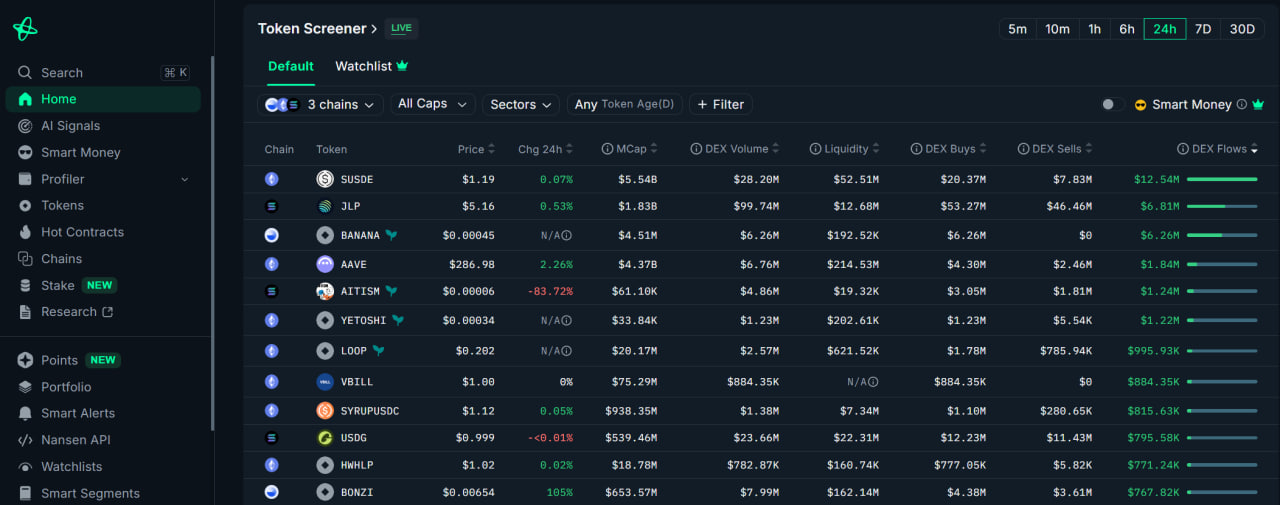
Nansen specializes in wallet analytics and tracking “smart money” behavior. This tool is especially useful for those studying the DeFi and NFT sectors. Key features include:
-
Real-time transaction analysis
-
Tracking portfolios of large players
-
Identifying trends in new tokens
-
Tools for NFT market analysis
Wallet Tracking and Smart Money
One of Nansen’s main advantages is the ability to study the actions of large investors. For traders, this is a source of insights, since capital flows often indicate future trends.
Possible wallet tracking use cases:
-
Identifying new tokens being accumulated by funds
-
Monitoring exits of large holders from an asset
-
Studying hedge fund strategies in DeFi
-
Comparing the activity of different categories of investors
This approach allows you to gauge market sentiment based on the actions of those who have significant resources and influence on assets.
Basics of Working with Dune Analytics
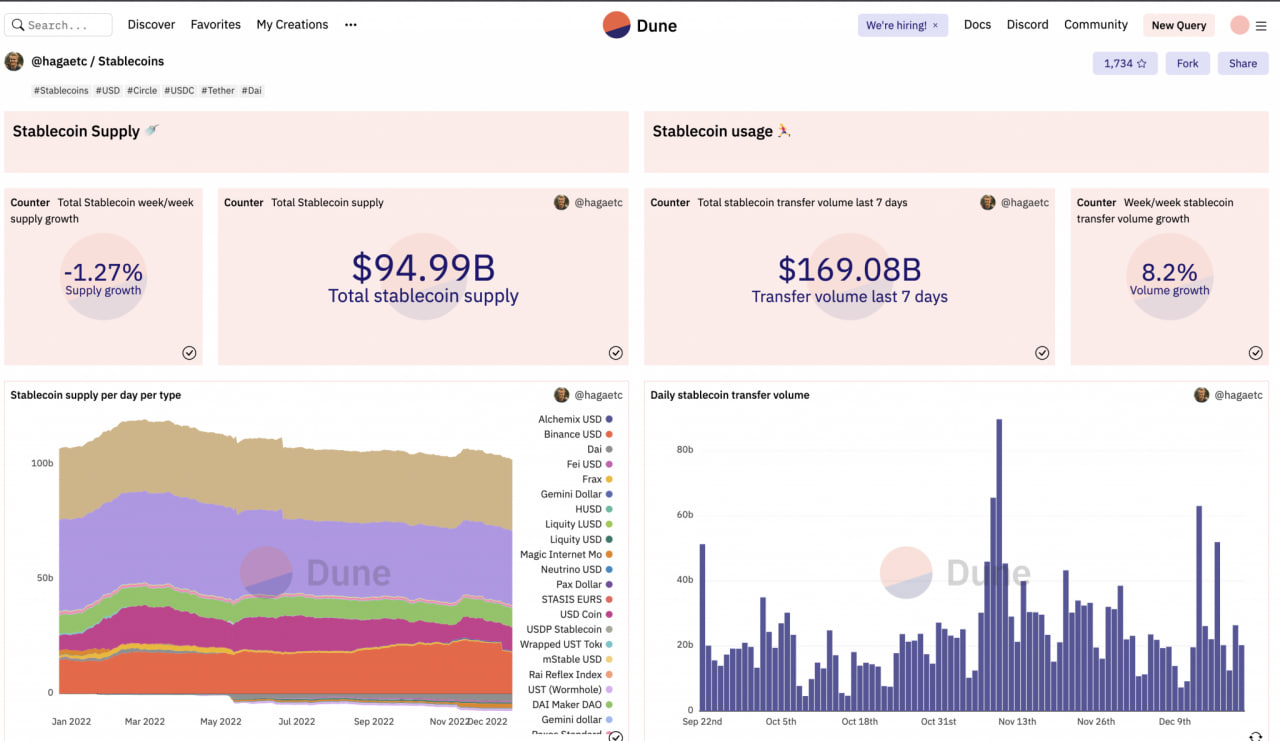
Dune is a platform for analyzing DeFi protocols and Web3 projects. Here, users can build their own queries and dashboards, analyzing any blockchain data. For beginners, a library of ready-made solutions is available.
Strengths of Dune:
-
Free access to many dashboards
-
Ability to customize personal panels
-
Support for smart contract analysis
-
Community-published research
How to Find and Use Ready-Made Dashboards
Beginners don’t necessarily need to learn SQL query language. It’s enough to use existing panels. On Dune, it’s easy to find dashboards for DeFi protocols, tokens, or NFT projects.
Examples of use:
-
Analyzing liquidity in a DEX pool
-
Studying staking yields
-
Monitoring the growth of NFT project audiences
-
Evaluating smart contract activity in real time
Dune provides users with a wide range of options. Beginners can use ready-made dashboards, while advanced users can create their own, improving the quality of their analytics. Thanks to this, Dune suits all types of users, regardless of experience or skills.
Advantages and Limitations of On-Chain Analytics
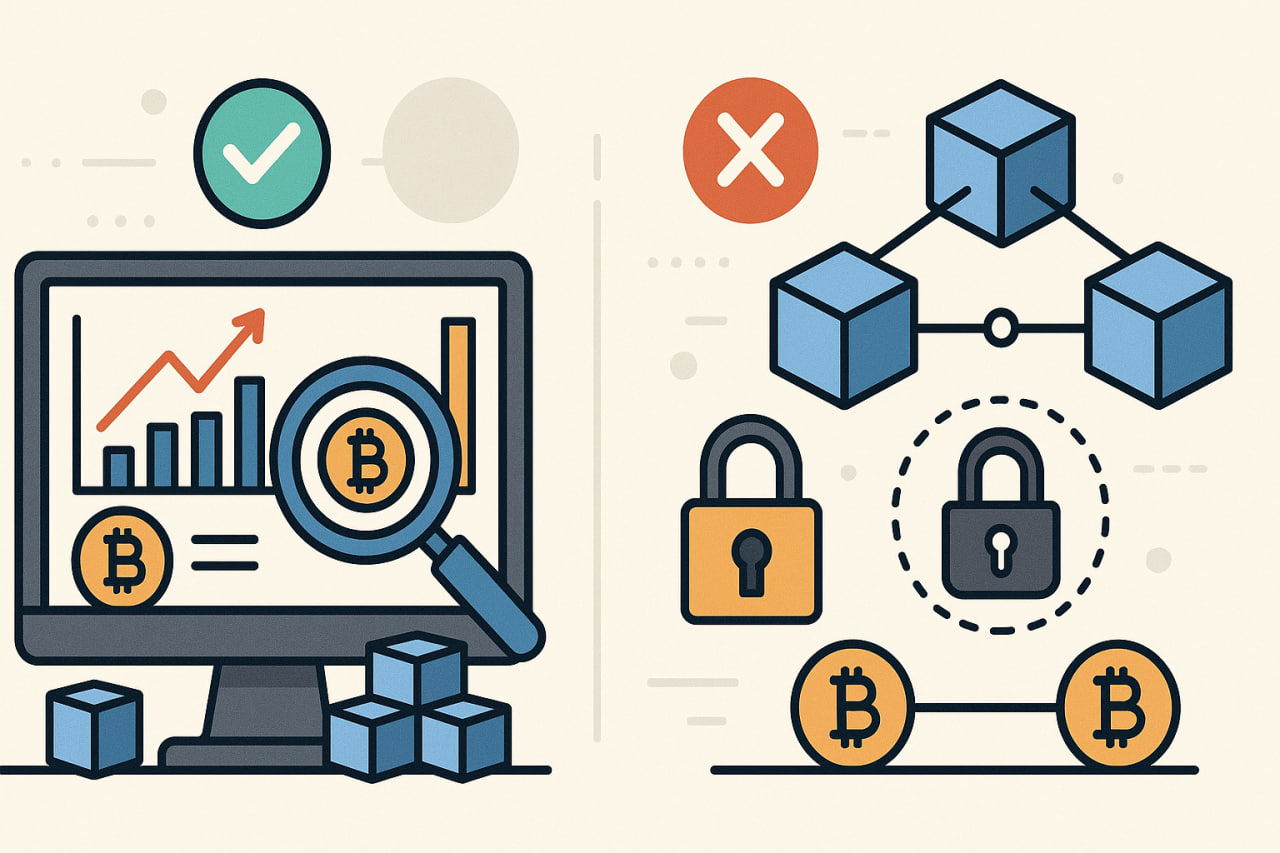
On-chain analytics opens new horizons of market understanding for investors and traders. Its strengths include:
-
Data transparency and independence from intermediaries
-
Ability to identify trends at an early stage
-
Availability of tools for traders and investors with different experience levels
However, there are also limitations to consider:
-
Complexity of interpretation without proper expertise
-
Need to correlate data with external factors
-
Risk of misinterpretation
To minimize this risk, one should carefully and calmly approach the interpretation of on-chain data, avoid hasty conclusions, and account for context and external conditions.
The Future and Prospects of On-Chain Analytics
With the development of Web3 and growing institutional interest in cryptocurrencies, the role of on-chain analytics will only increase. The complexity of decentralized protocols requires more detailed monitoring of capital flows, user activity, and smart contract transparency.
In the future, we can expect deeper integration of on-chain metrics into trading platforms and analytics dashboards, making such data a standard part of every investor’s toolkit. The market is gradually moving beyond individual networks, and analysis of multichain ecosystems and cross-chain transactions can greatly help different user groups — from retail investors to institutions and funds.
Conclusion
Crypto market analysis has never stood still; every year new technologies, tools, and metrics emerge. On-chain analysis has quickly proven its effectiveness and continues to grow as a field. Glassnode helps explore key metrics, Nansen reveals the actions of large players, and Dune provides access to in-depth DeFi analytics.
Using these tools helps market participants better understand the market, build analysis on transparent data, and catch upcoming changes earlier.