Определяем волатильность правильно
John Bollinger introduced to the community the indicator of the same name for asset analysis in the 90s. The method quickly became popular and is now used by traders around the world.
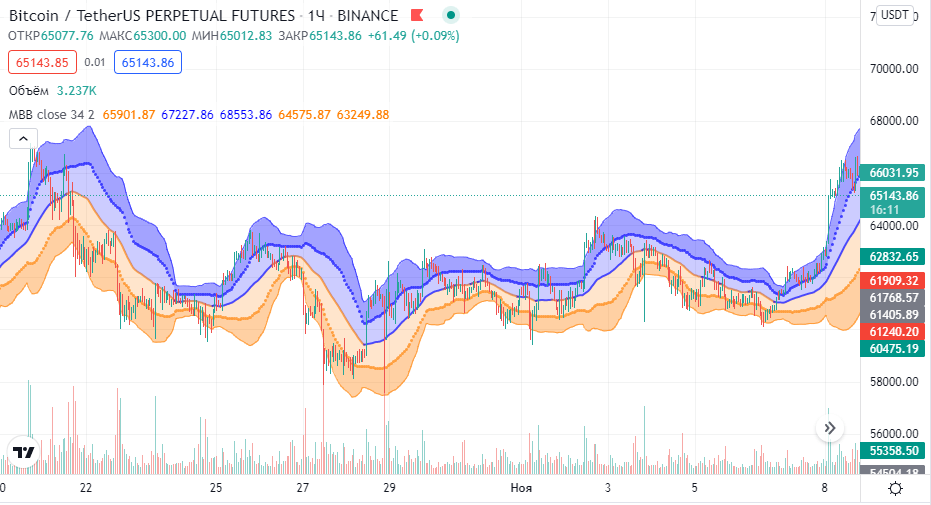
The idea behind Bollinger Bands is to combine a trend, volatility, and an oscillator. The bands show the range of fluctuations in quotes typical for the current trend movement. The method uses three types of lines: a moving average in the middle (shows the main movement of the chart) and a pair of lines that determine the min and max of the asset value. Therefore, it is easy to determine the state of a financial instrument (overbought or oversold) by using Bollinger bands.
Индикатору присущи такие особенности:
•Если область между min и max сужается, это говорит о вероятном развороте тренда, если расходятся – текущее движение сохраняется;
•The direction of the trend is determined relative to the moving average. If the trend is higher, then the movement is upward;
•Движение одной границы, вероятно, приведет в действие и вторую.
Полосы Боллинджера легко использовать для:
•Распознавания двойных основания и вершины;
•Открытия/закрытия ордеров после откатов;
•Определения резкого изменения цен (полосы сужаются).
Сегодня Джон Боллинджер владеет компанией, которая использует методы основателя в профессиональной деятельности.