Timeframe Analysis: How to Choose the Right Interval for Crypto Trading

Contents
- Introduction
- What are the timeframes in trading
- How to choose the right timeframe for crypto trading
- Multi-timeframe analysis
- Typical mistakes when choosing a timeframe
- Conclusion
Introduction
In cryptocurrency trading, timeframes play an essential role. A timeframe is the time interval used to build a price chart. The chosen interval determines what market movements a trader sees and what decisions they make. The same asset looks completely different on a one-minute chart compared to a daily chart, so choosing the correct scale often affects the quality of analysis and the effectiveness of trading strategies.
What are the timeframes in trading
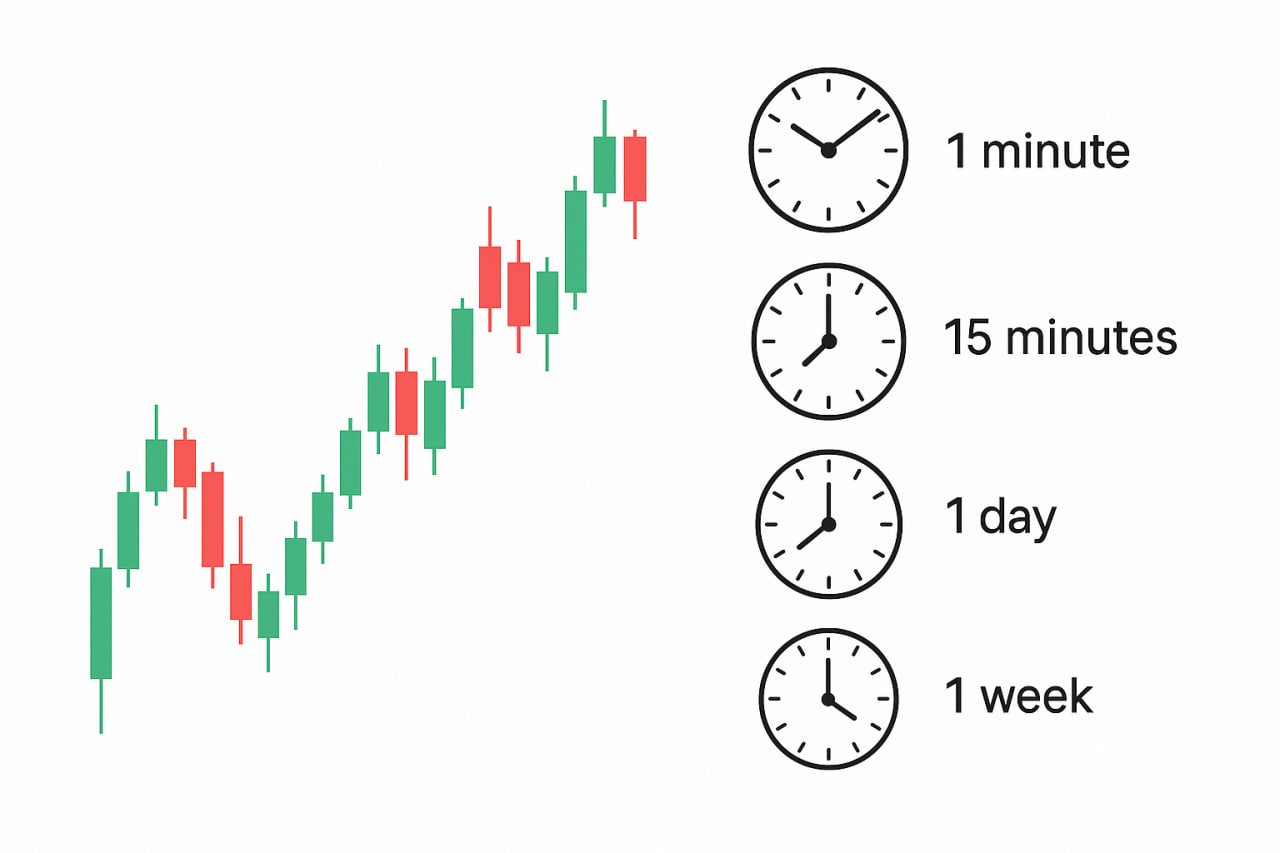
A trading timeframe is the period of time that is displayed on a chart as one candlestick or one bar. With a 1-minute interval, each candle represents price changes over a one-minute period; with a daily interval, it shows the movement over a single trading day.
In practice, traders most often use these intervals:
-
1 minute and 5 minutes — for fast intraday trading;
-
15 minutes and 30 minutes — for steady day trading;
-
1 hour and 4 hours — for swing trading;
-
1 day and 1 week — for long-term analysis and investment.
Short-term timeframes
One-minute and five-minute charts are used in intraday trading. These intervals generate numerous signals, enabling quick reactions to local price changes. At the same time, on short timeframes, the share of false signals often increases, so a clear entry plan and strict risk management rules are essential.
Medium-term timeframes
Hourly and four-hour charts are suitable for those who are not ready to sit at the terminal all day but still want to work with price moves within the week. The hourly interval helps to see key intraday swings and build short-term scenarios. The 4-hour chart is more commonly used for a swing approach, as it reduces market noise and helps assess trends more accurately.
Long-term timeframes
Daily and weekly charts are applied in positional trading and investing. These intervals reveal larger trends and enable decisions without the need for constant monitoring of the ticker. A daily chart helps evaluate direction for the coming weeks, while a weekly chart provides a broader horizon and supports planning trades for months ahead.
How to choose the right timeframe for crypto trading
The right timeframe depends on the trading style, market volatility, and goals. One trader may focus on minute-to-minute changes, while another watches moves lasting weeks. It is essential to align the interval with the task and acceptable risk level.
Key factors to consider:
-
Trading style — scalping, day trading, swing, or investment approach.
-
Market volatility — when price fluctuations are high, shorter intervals help control risk; in calmer dynamics, longer intervals are more useful.
-
Trading goals — quick profit-taking or gradual capital growth over the long term.
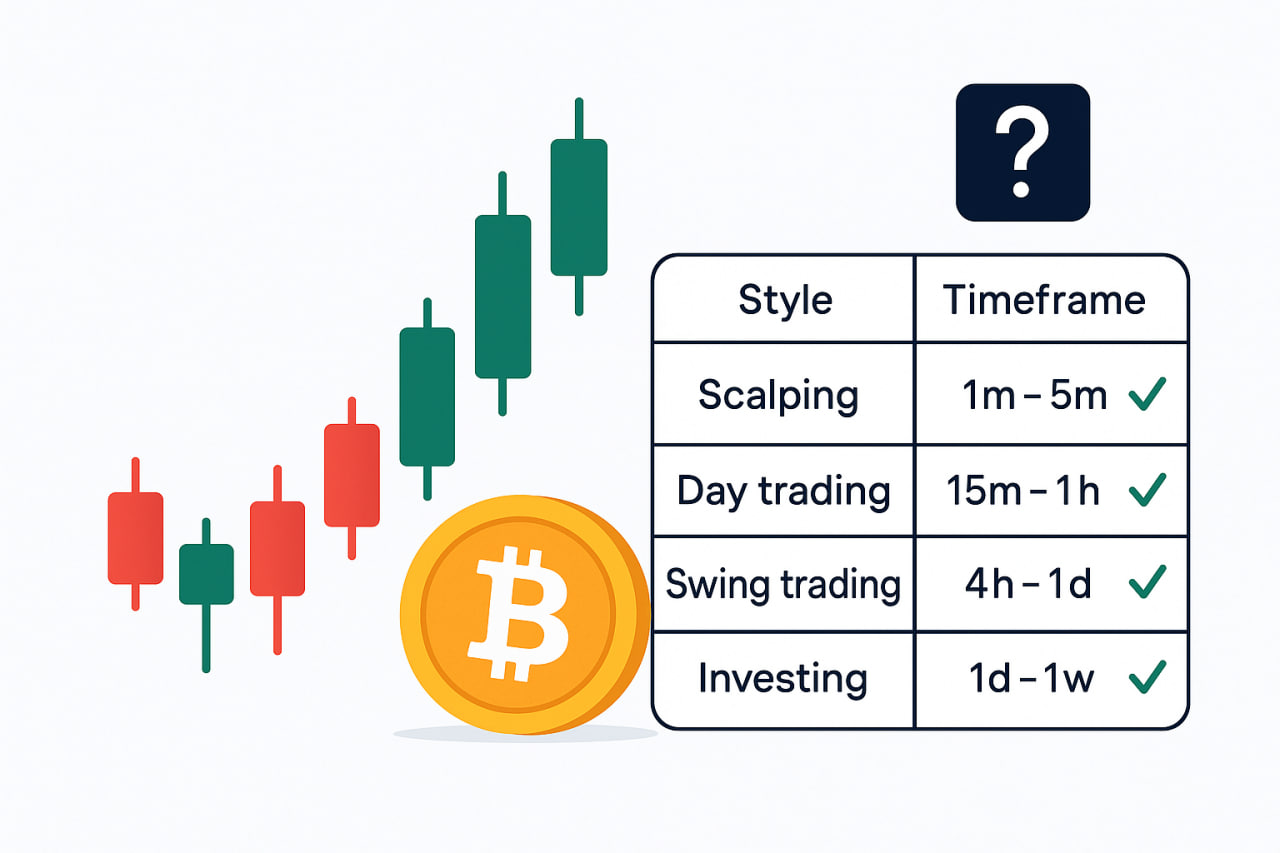
Comparison of styles and intervals:
Trading style | Suitable timeframes | Application features |
Scalping | 1m – 5m | Many entry points; usually a higher share of false signals; strict risk management required |
Day trading | 15m – 1h | Trades within a day; moderate number of signals; requires monitoring of news and liquidity |
Swing trading | 4h – 1d | Holding positions for several days, focus on trend waves and key levels |
Long-term investing | 1d – 1w | Oriented toward global trends, less market noise, emphasis on fundamental factors |
Multi-timeframe analysis
The essence of this method is to view the same asset across several scales. A higher timeframe (such as a day or week) sets the context and direction. A working timeframe (4 hours or 1 hour) helps define the trade area. A lower timeframe (15 or 5 minutes) specifies the entry point and risk level. This sequence often improves decision quality and the risk-reward ratio, as short-term signals are aligned with the broader picture.
Additionally, some platforms offer access to features for replicating the best strategies of top traders. For beginners, this becomes an opportunity to observe what timeframes professionals use and learn how to work with them in practice. Such an approach combines theory with real-world experience: a trader not only mirrors trades but also observes how different intervals are applied in actual trading strategies.
Practical application
-
Uptrend. On the daily chart, a series of higher lows forms. On the 4-hour chart, a pullback to support appears. On the 15-minute chart, a confirming signal occurs: a breakout of a local level is followed by a retest, accompanied by rising volume. The stop is placed behind the nearest low on the lower chart; the target is the resistance zone seen on the higher timeframe.
-
Sideways market. The daily interval shows a range. The hourly chart defines the corridor boundaries. In 5–15 minutes, an entry is sought at the edge of the range with a short stop and fixed targets inside the corridor.
-
Swing scenario. The weekly chart indicates an ascending channel. ** On the 4-hour chart, a pullback to the trendline develops. A reversal candlestick pattern indicates confirmation on the 1-hour chart. Entry is based on the lower timeframe signal; targets are the levels outlined on the weekly chart.
Typical mistakes when choosing a timeframe
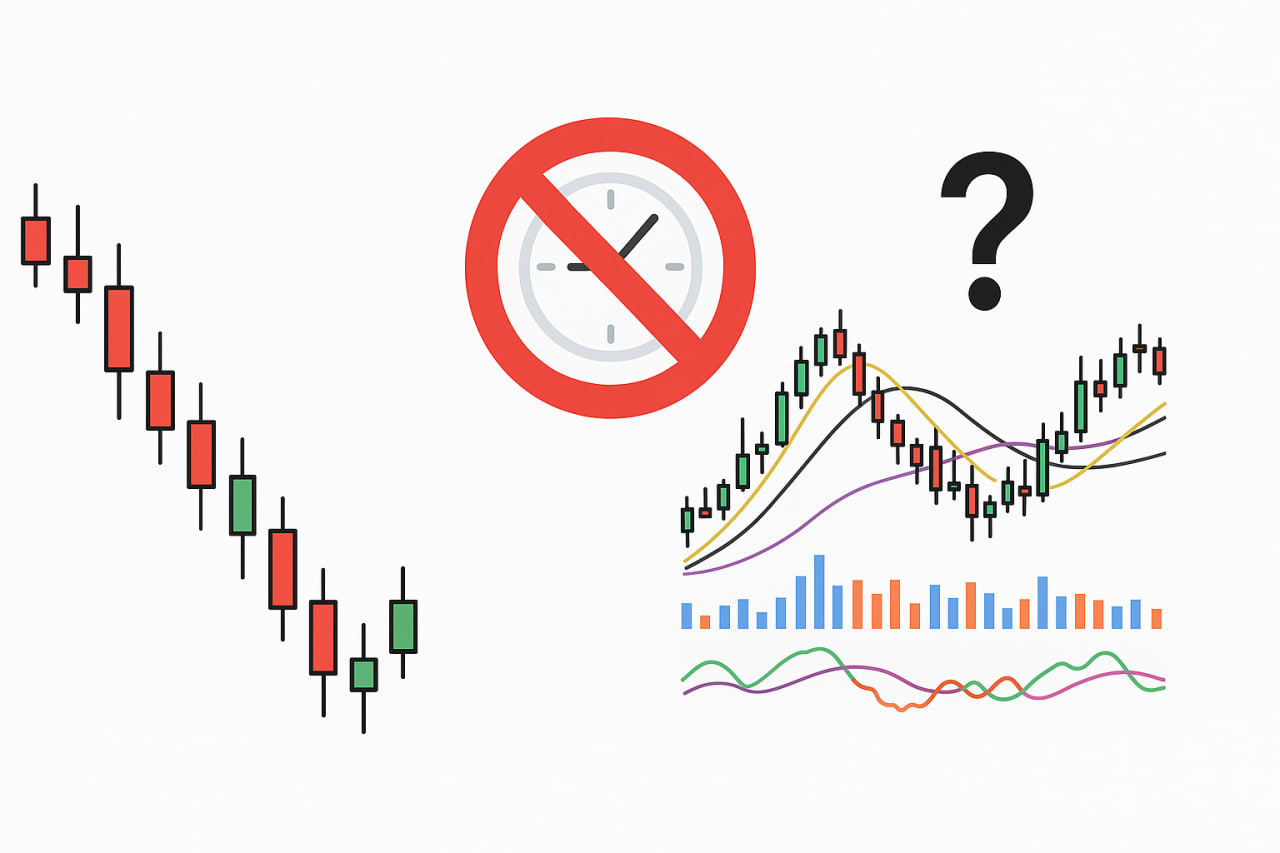
-
Too short an interval. Minute charts often produce more false signals and increase the trader’s workload.
-
Ignoring the higher context. Trades against the daily trend more often result in stop-outs.
-
Constant switching of intervals. Inconsistent scales disrupt the plan and undermine discipline.
-
Overuse of indicators. Different sets on every chart reduce coherence; typically, two to three key metrics are sufficient.
-
One scale for all conditions. With higher volatility, another interval or smaller position size is often required.
-
Mismatch of goals and scale. Scalping with daily targets or swing trading with a minute-based stop creates a risk-acceptance imbalance.
Conclusion
Choosing a timeframe depends on the trader’s goals, acceptable risk, and market conditions. There is no universal answer to the question of the “best interval.” However, combining several timeframes often strengthens decisions: higher ones show the general trend, lower ones refine the entry and trade parameters. As a result, the approach becomes more balanced, and risk management becomes more transparent.