Volume profile and how to use it
The Volume Profile is an advanced indicator that displays trading activity over a specified period at selected price levels. The indicator is calculated according to the parameters entered by the user, namely the number of lines and the period.
The indicator plots a histogram on the chart, which reflects the dominant or important price levels based on the volume. Moreover, the volume profile takes into account the total trading volume at one price level at a specific time, and divides it by the buy and sell volume, and then provides this information to the trader.
POC stands for the ratio of the volume that is traded most often to the price for a given amount of time. You can also observe where the largest volume is traded in a special area of the screen. There are various profile settings that you can adapt to suit your trading style and strategies, which we’ll talk about next.
With today’s advanced charting platforms, virtually any trader can access this type of market analysis to determine where trading activity has taken place and how much (volume) trades have taken place at each price level. Here we take a closer look at the volume profile and explain how it can be used to determine trade entries and exits.
Many traders are used to viewing volume as a histogram below the price chart. This approach shows the volume traded during each price scale, whether it is a time scale (for example, a minute) or an activity-based scale (for example, a 144-tick or 2000-tick chart). While this is a popular method of analysis, knowing where volume is happening – in terms of price, not time – may be more meaningful.
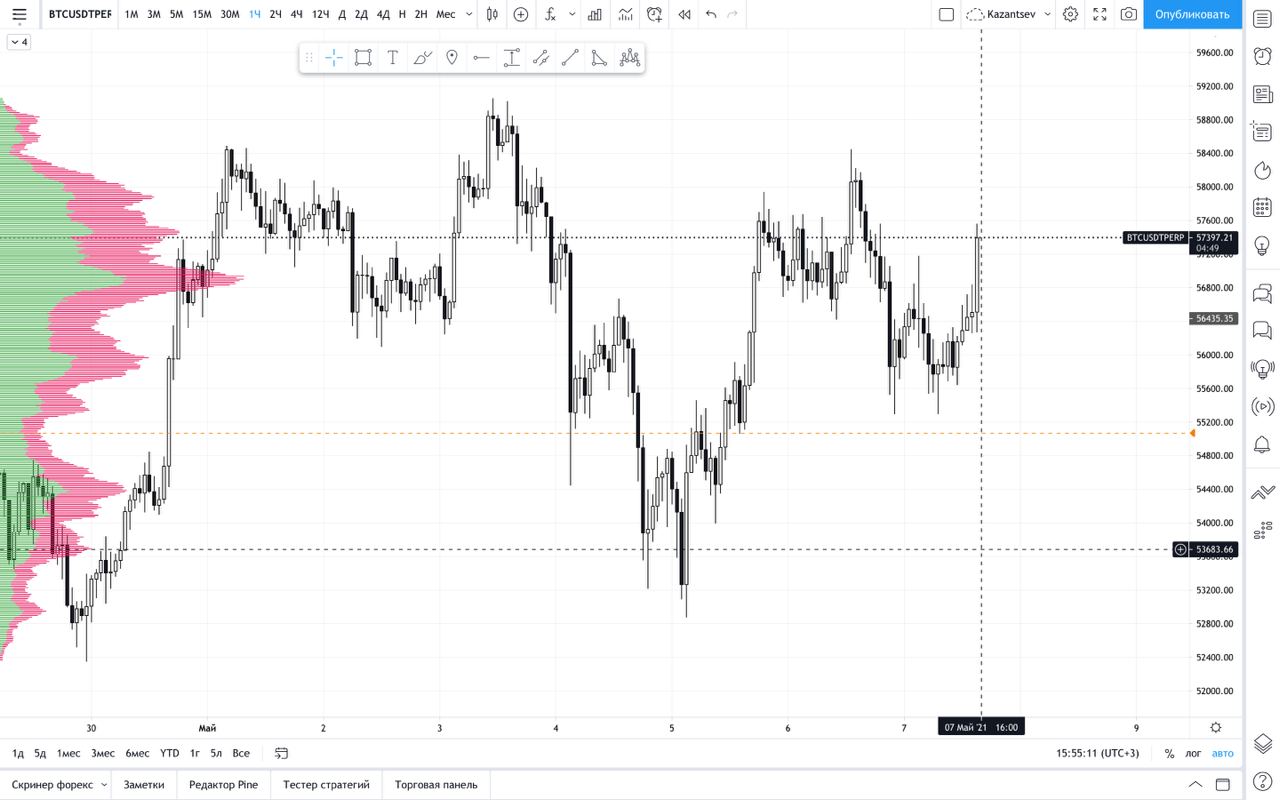
Volume profile plotted on the vertical axis of the chart.
The volume profile plotted on the vertical axis of the price chart shows how long it took to trade at each price level.
Why is this useful for traders? The indicator indicates prices that have been approved by the market as well as those that have been ignored, which can give traders a clue as to where the price is likely to go shortly.
Identify high and low volume areas for the best opportunities.
The volume profile is updated every time a new trade order in the market is filled and the control point, range, high volume nodes, and low volume nodes change many times during the trading time, especially for actively traded instruments, as the volume increases, activity is recorded … As the volume profile develops throughout trading time, new patterns and opportunities appear.
For example, at 11 a.m., the control point can be located in the upper part of the chart (closer to the maximum of the range of values), only to be replaced by a higher trading volume later during the trading session.
For active traders, the evolving volume profile is most relevant. The indicator at the end of the day will display the history of volume, but not the patterns that can identify trading opportunities during active trading times. It is this constant evolution of the volume profile during trading times that can aid in decision-making.
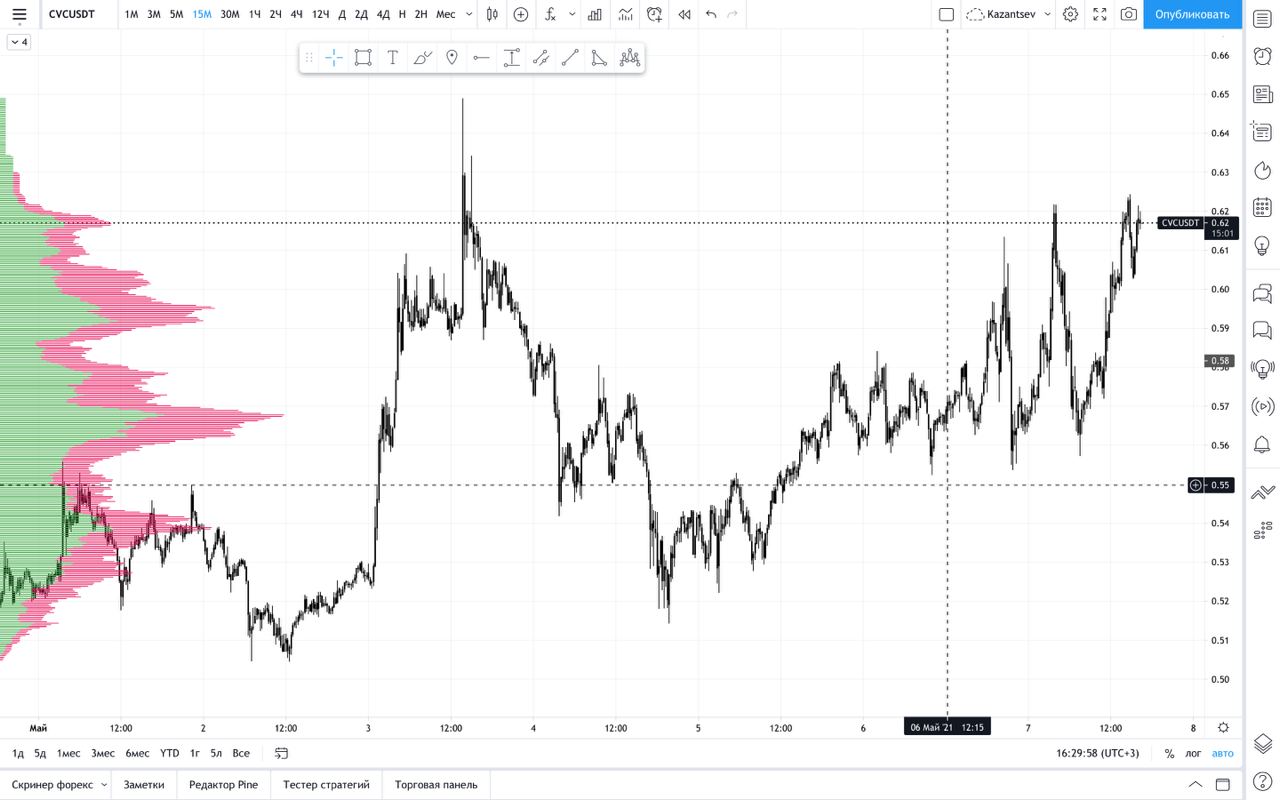
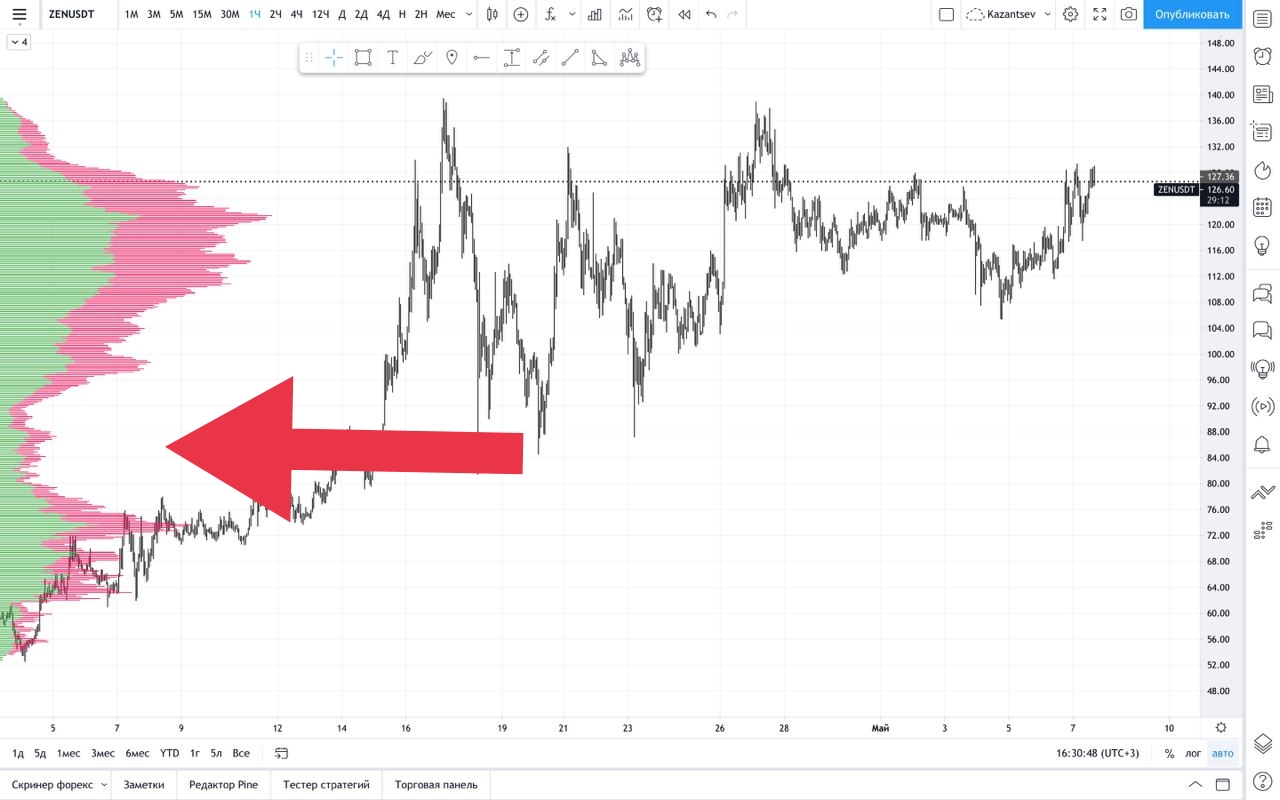
An example of a low and high volume trading node
In our example, we’ll look at a potential entry point by looking for a low-volume node.
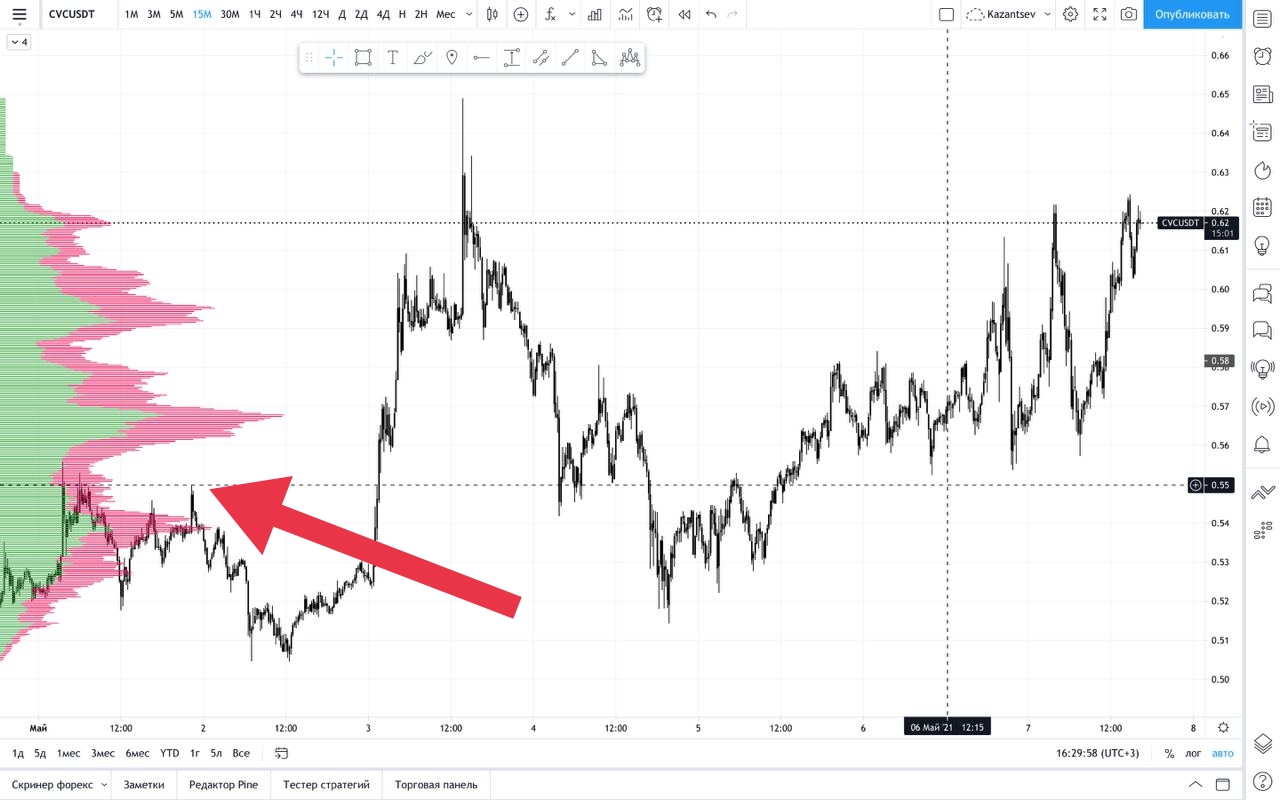
Low volume nodes can provide good trades as they provide prices that were previously skipped and trading activity is likely to stop quickly. We will expect this to happen again as we think the price will move in the direction of the control point. Placing a buy stop order at the first node with low volume above the current price can ensure a good trade conclusion.
Example strategy
Like most other tools or studies, the volume profile has some uses. Many trading strategies use a profile as a key component. Below are the basics of one such strategy based on comparing the current day’s open price to the previous day’s volume profile.
If the current day opens above the previous day’s value area (but still below the high of the profile), try to get the price back to the Control Point and then continue to rise (direction of the day’s open). Therefore, there is a buying opportunity during a pullback to the Control Point. If the current day opens below the previous day’s value area (but still above the profile low), try to get the price back to the Control Point and then continue falling (direction of the day’s open). Therefore, there is a selling opportunity during a pullback to the Control Point.
If the opening price of the current day is completely outside the profile of the previous day (above the high of the profile or below the low of the profile), this can be considered as a possible price movement in the direction of the opening relative to the range of the profile of the previous day.
What have we learned about the volume profile?
In summary, the volume profile is an extremely valuable technical analysis tool used by traders everywhere. The key to the continued relevance of the volume profile is its versatility. It is a charting tool that has a wide range of uses. Unlike many other studies, there is little debate about the usefulness of a volume profile. The volume profile shows traders where and how much volume was sold during a trading session. Since it is dynamic and changes every time a new trade order is executed, it can be especially useful in day trading. It should be noted that the example shown here is just one way to incorporate a volume profile into a trading plan or strategy. Traders can experiment and observe to find unique ways to use this important trading tool.