Vortex indicator
Indicator Description
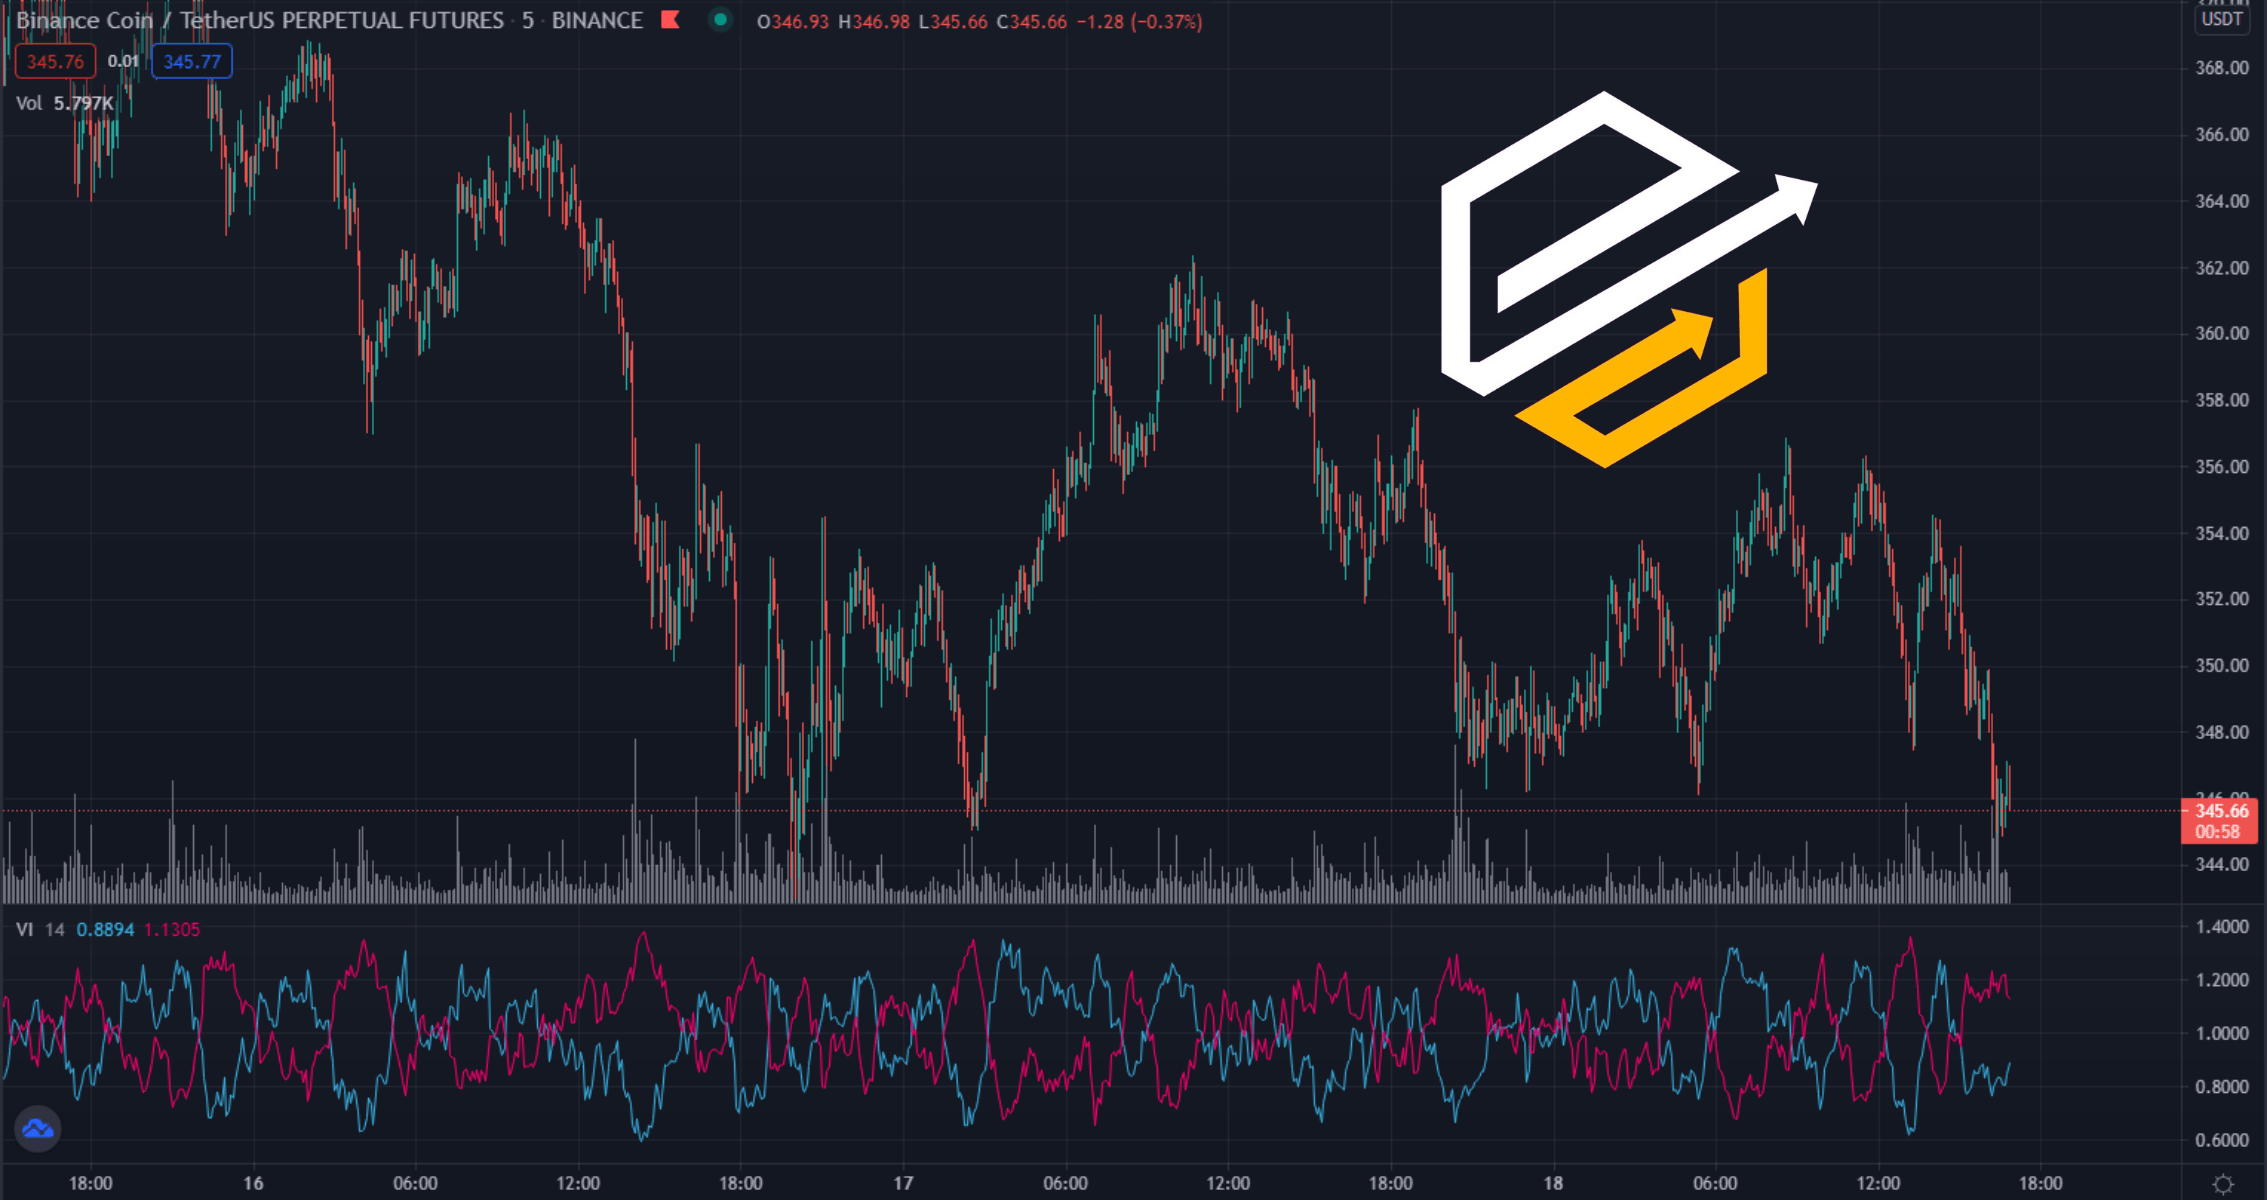
The Vortex indicator consists of two oscillating lines. They help confirm a trend and predict a change in direction.
One line of the vortex indicator identifies positive price movement (+ VI), and the other negative (-VI). The points of intersection of the lines are decisive. These crossovers give buy or sell signals.
Vortex indicator calculations are based on lows and highs over some time. A positive trend movement is determined by the length between the recent low and the current high. The distance between the last high and the current low indicates a negative trend movement. The distance is greater when the price movement is stronger.
The indicator period can be adjusted according to your needs. The readout results are presented as two oscillating lines. Crossovers create signals to enter a trade, however, it would be a good idea to use additional indicators to avoid false signals and rapid reversals.
Using
It is recommended to use an additional indicator to confirm entry points for your trades. Together with the moving average, it creates a perfect pair with the vortex indicator.
It is recommended to leave the default MACD settings. But you can experiment with the vortex indicator settings.
Look for triggers for both indicators. When they occur at the same time (this does not have to be the exact time), you can be sure that the signal to open a trade position is strong. For whirlwind trading, the MACD is an excellent choice.
Enter a buy position when a crossover occurs after a long downtrend. They should be close enough to each other, but not necessarily intersect at the same time. A distance of 3 to 4 candles is a reliable length. With a 5-minute time frame, you can keep the transaction open for about 30 minutes.
Enter a sell trade when the intersection of both indicators occurs after an uptrend. Again, you can keep your position open for about 30 minutes if using a 5-minute timeframe.
Conclusion
The vortex indicator is based on the work of J. Wells Wilder. He also invented other technical indicators. A vortex is a trend following indicator that consists of two oscillating lines. Intersection points indicate good entry points.
Use another indicator like MACD to avoid false signals. This will increase your chances of success.