How to Use the Fear and Greed Index
Contents
- Introduction
- What Is the Fear and Greed Index
- How to Read and Analyze the Index
- Using the Index in Crypto Trading
- Limitations and Risks
- Conclusion
Introduction
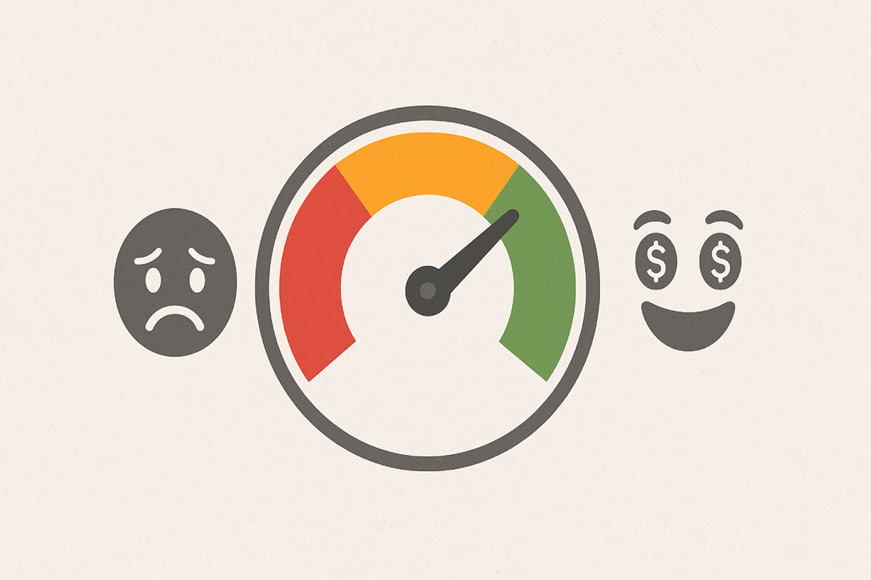
In the cryptocurrency market, everything changes fast. People buy and sell assets based not only on numbers but also on emotions. Panic can cause a sharp drop, while greed can trigger rapid growth. To understand the current state of the market, traders use the Fear and Greed Index. It shows whether there is more fear or more desire to make money.
This tool helps you view the market from a distance. It reveals when the crowd is afraid and when it’s overly confident. Strong price movements often accompany such periods. That’s why investors and traders monitor and use the index when making decisions, both in crypto and traditional markets.
What Is the Fear and Greed Index
History and Developers
The idea of the index came from the traditional stock market. CNN developed it to track investor sentiment in equities. Later, a version was created specifically for cryptocurrencies, tailored to the unique characteristics of the crypto market and analyzing participant behavior based on available data.
The crypto index gathers information from exchanges, social media, and other open sources to reflect the market’s current emotions. This allows traders to spot dangerous sentiment extremes early.
Index Value Interpretation
To determine whether the market is dominated by fear or greed, the index analyzes several factors:
-
Volatility. Intense price swings indicate fear. A stable market reflects calm sentiment.
-
Trading volume. An increase in volume can signal heightened activity, either from confidence or panic.
-
Social media. Posts, discussions, and message tone all reflect market mood.
-
Google Trends. If people frequently search for terms like “crash” or “market drop,” fear is rising.
-
Surveys and polls. Sometimes, investor sentiment is measured through direct feedback.
-
Bitcoin dominance. When interest in Bitcoin rises, it may signal that traders are avoiding risk.
Index Value Interpretation
The index shows a score from 0 to 100:
Index Value | Interpretation | Description |
0–24 | Extreme Fear | The market is dropping; participants are panic selling |
25–49 | Moderate Fear | Investors are cautious, but there’s no mass panic |
50 | Neutral | Balance between buyers and sellers |
51–74 | Moderate Greed | Market participants are confident, buying increases |
75–100 | Extreme Greed | The market is overheated, high chance of correction |
The index helps gauge whether emotions are distorting judgment. For instance, extreme greed might suggest an asset is overvalued, while extreme fear can indicate a buying opportunity.
Market Examples
In May 2021, Bitcoin saw a sharp decline. The Fear and Greed Index dropped below 20, indicating extreme fear, and soon after, the market began to recover. Many who bought during that dip made a profit.
Another example is late 2020, when the index consistently showed high greed. The market was climbing, and it seemed like the rally would never end. But a correction followed, proving that greed often precedes a downturn.
How to Read and Analyze the Index
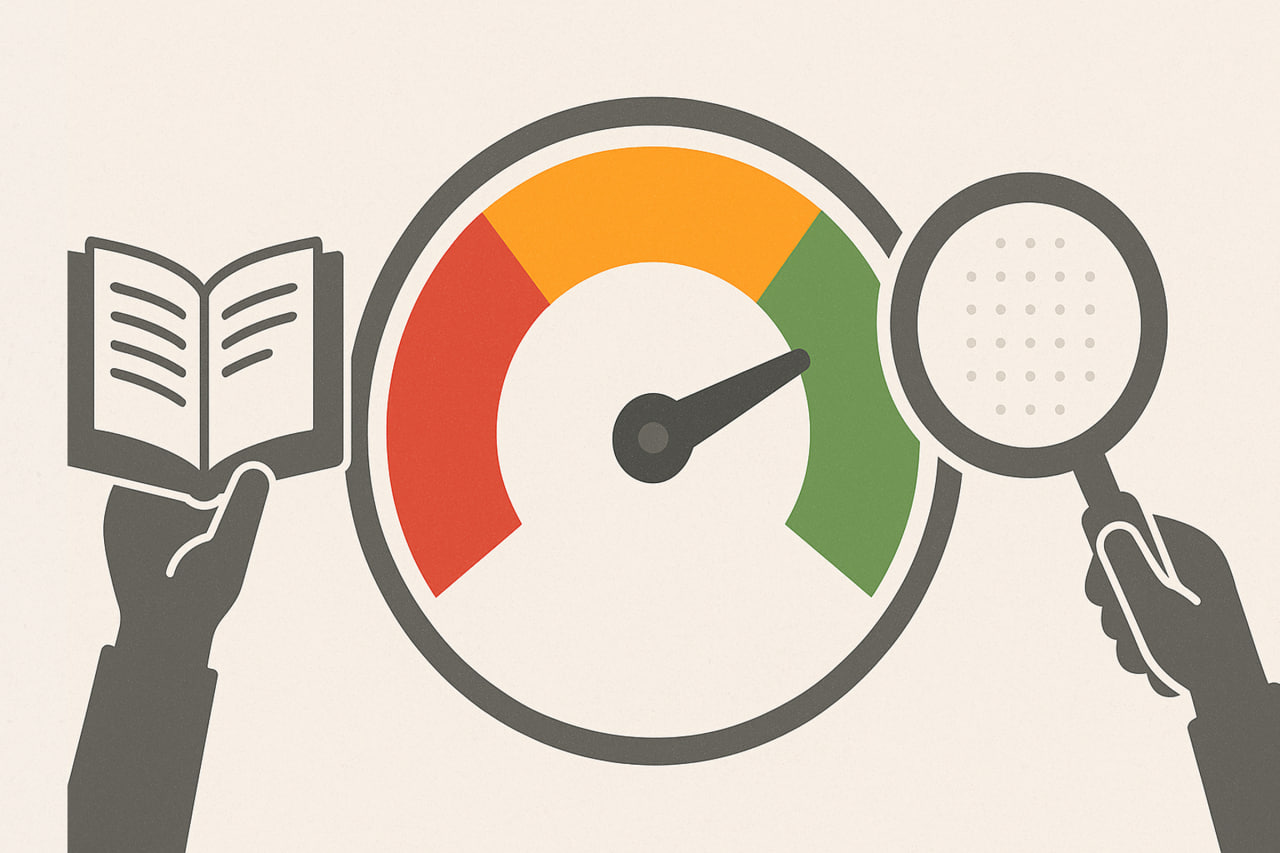
Where to Find Data
The crypto Fear and Greed Index can be tracked on specialized platforms. Below are some of the most popular sources for current index values and historical trends:
-
alternative.me — the primary and most frequently used source.
-
CoinMarketCap — displays the index in its analytics and news section.
-
CoinGecko — offers sentiment indicators.
Some crypto bots on Telegram also post index updates, but it’s better to rely on verified sources to avoid misinformation.
Timeframe Selection
It’s important to understand that the index can be viewed over different periods:
-
Daily value reflects what’s happening right now. Useful for day traders and short-term strategies.
-
Weekly value shows the general trend and filters out noise. Good for avoiding rash decisions.
-
Monthly value suits long-term investors and reflects how sentiment has evolved.
The choice depends on your trading style. Active traders benefit from the daily index; strategic investors may prefer weekly or monthly data.
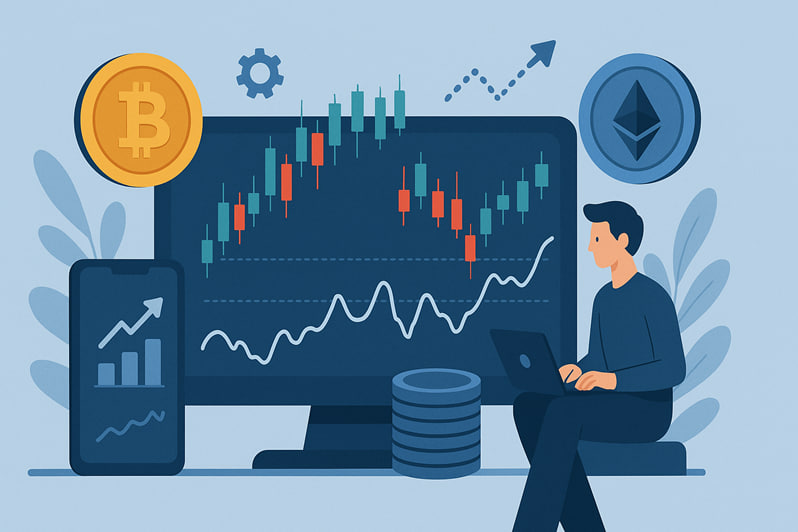
Using the Index in Crypto Trading
Contrarian Strategy
One popular approach is to act against the crowd. Buy when others are fearful, and sell when others are greedy. This principle aligns well with the Fear and Greed Index.
For example, if the index drops below 20, it might be a buying opportunity. People are panicking and selling, allowing you to enter at a lower price. Conversely, if the index rises above 80, the market may be overheated — a good time to consider selling or locking in profits.
This strategy doesn’t always work, but it often helps avoid common traps caused by herd behavior.
Integrating with Other Indicators
The index works best alongside other tools. One option is moving averages (MA). If the index shows fear and the price nears strong support, it could be a good buy signal.
Trading volume is also practical. If prices fall due to low volume, it might be false panic. High volume, however, suggests more serious pressure.
Another popular tool is RSI (Relative Strength Index). It shows whether an asset is overbought or oversold. If RSI is low and the Fear Index is high, this might signal intense pressure — and a possible entry point.
Combining multiple indicators leads to more accurate analysis and reduces the risk of mistakes.
Limitations and Risks
Lag and False Signals
Although the Fear and Greed Index is valid, it’s not always accurate. It reflects data from past events, which means it may lag. When the index shows extreme fear or greed, prices might have already started to reverse.
Also, the index doesn’t always reflect actual conditions. Sometimes it reacts to temporary noise — like a tweet or rumor — which changes the index sharply even if the news has no real substance. This can generate false signals and mislead traders.
That’s why the index should never be used in isolation. It’s the best part of a broader strategy, not a standalone decision-making tool.
Emotional Overreliance
Another risk is that the index itself can trigger emotions. Extreme fear can make someone nervous, and extreme greed can cause FOMO, which may lead to impulsive actions.
It’s important to remember that the index doesn’t give commands. It reflects mood—the decision is up to the investor. Relying on it too heavily can lead to overtrading, unnecessary fees, and mistakes.
Stick to your plan. The index can assist—but should not dictate—your decisions.
Conclusion
The Fear and Greed Index is a simple and visual tool. It shows how the market is feeling and helps anticipate the behavior of other participants. When there’s panic, it might be a good time to enter. When everyone is overconfident, it’s wise to be cautious.
But remember — it’s not a magic button. The index shows sentiment, not the reasons behind price movements. To use it effectively, combine it with other data, stay updated on news, and stick to your strategy.
When used wisely, the index can help you make more informed decisions and stay calm when the market gets turbulent.