How the Realized Calculation Model Differs from the Unrealized Model, and Why They Are Crucial for Comprehensive Trading Statistics

If you’re already familiar with our platform TradeLink Passport, you’ve probably noticed similar metrics on various charts, such as “Profit %” and “Realized Profit %,” “Balance” and “Margin Balance,” and so on.
Such a powerful tool for portfolio analysis as the use of different calculation models often goes unnoticed due to the difficulty in understanding the differences between them. Today, we aim to clarify these distinctions by explaining the difference between realized and unrealized calculation models, along with examples to illustrate their usefulness.
Contents
- How Does the Realized Model Differ from the Unrealized One?
- Let’s Analyze a Few Examples:
- Other Platforms Providing Historical Unrealized Profit Charts
- Versatility of TradeLink Indicators for All Users
How Does the Realized Model Differ from the Unrealized One?
If you’ve traded cryptocurrency futures, you may already be familiar with terms like “Margin,” “Margin Balance,” and “Realized Loss.” In short, the margin balance represents the total value of assets in a futures account if all positions are closed at the current market price.
If you’re more deeply immersed in the world of futures trading, you may have come across the term “Realized Balance.” Simply put, the realized balance shows the total assets in a futures account without including the profit and margin (collateral) of open positions.
The main difference here is that the realized balance excludes profit and margin, whereas the unrealized balance includes them. We decided to slightly modify these concepts to our platform in order to provide users with the maximum amount of information, enabling them to draw conclusions about the qualities of a particular strategy.
Thus, two fundamentally different types of calculations are available on the platform: based on realized and unrealized margin. Passport allows you to view profit and balance charts over the entire trading period of an account, enabling you to evaluate the size of unrealized drawdowns at one point or another.
Let’s Analyze a Few Examples:
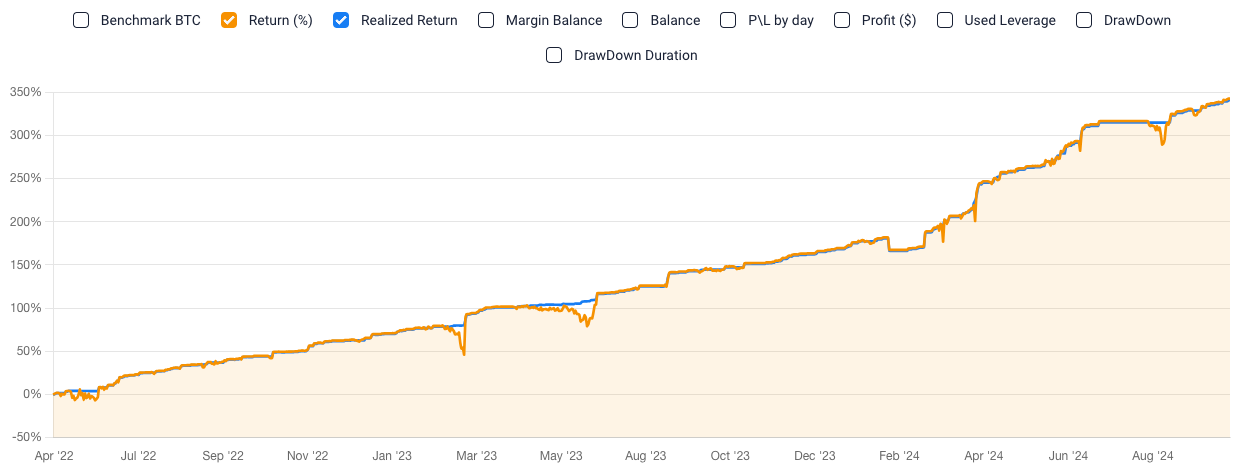
The image shows the chart legend: the blue line represents realized profit, while the orange line shows unrealized profit.
As seen in the example, this strategy experienced several periods where it demonstrated an unrealized drawdown, meaning the sum of open positions was in the negative zone, and the strategy was, in effect, at a loss at that moment.
However, the realized profit chart shows no drawdowns since the positions with unrealized losses were not closed at a loss and were ultimately closed at break-even or even in profit. Therefore, the unrealized profit chart allowed us to observe drawdowns that actually existed on the account but would be difficult to detect with less advanced tools.
For this portfolio, the unrealized profit chart enables us to infer that the strategy historically “sat through” losses, and, given the sharp recoveries from drawdowns, it likely uses a progressive position-increasing mechanism when price moves in an unexpected direction.
Using such a mechanism can either lead to a sharp loss of funds in the account or, on the contrary, yield above-market returns by leveraging the advantages of the strategy. This doesn’t mean that the strategy is good or bad, but this approach in analysis allows you to understand the logic of its work better, and draw certain conclusions for yourself. Let’s move on to the next example:
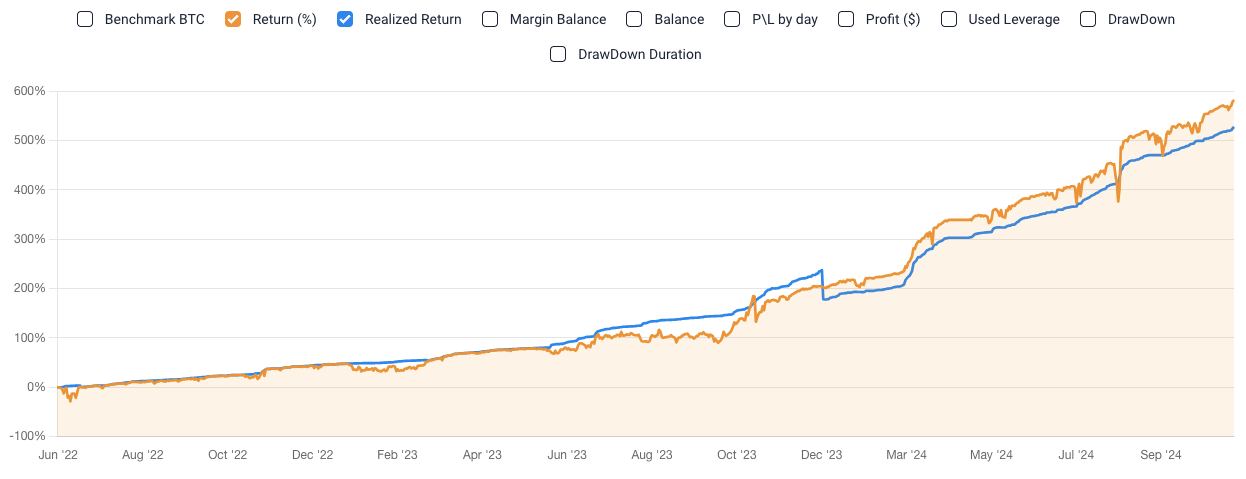
This chart displays a prolonged period of unrealized drawdown, visible by the difference between the unrealized (orange) and realized (blue) line charts. A sharp drop in the blue line shows that at some point, positions were closed with losses.
It can be inferred that the strategy now holds only profitable positions and closes them gradually (scales out of trades), which allows it to gradually accumulate realized profit. Holding only profitable positions (without closing losses) enables the blue line to maintain a smoother upward trend compared to the orange line, as each realized loss or profit contributes to the overall realized return.
By analyzing these examples, you can see the importance of the unrealized calculation model for a complete view of a trading strategy’s effectiveness. This system of calculations helps to identify strengths and weaknesses when unrealized profit drawdowns are visible, while realized return remains stable.
Other Platforms Providing Historical Unrealized Profit Charts
Currently, the TradeLink team is unaware of other platforms that offer indicators in two calculation types. If you know of such a platform, please inform us through support, we would be very grateful.
Unfortunately, the industry standard is realized calculations, which do not allow for a high-quality analysis of the history of most exchange strategies. We hope this article helped you understand the benefits of the unrealized calculation model and that we can make this model available to a broader audience.
Versatility of TradeLink Indicators for All Users
In regard with this information, TradeLink Passport defaults to displaying indicators based on the unrealized model. However, as each model has its own user audience, we have decided to duplicate calculations of most of the platform’s indicators for each type of margin.
The unrealized model allows you to see hidden drawdowns or temporary profits, while the realized model reflects only closed trades, providing an accurate picture of the actual income generated by the strategy. Using both models together is a powerful technical tool that allows you to understand the strategy’s mechanics, assess the associated risks, and see its strengths and weaknesses.