October 2024 Results

Hi there!
For the past month, we have been working without getting tired, and we would like to share with you some of the results of the work we’ve done.
Contents
TradeLink Marketplace Updates:
Developed hourly calculations for TradeLink indexes
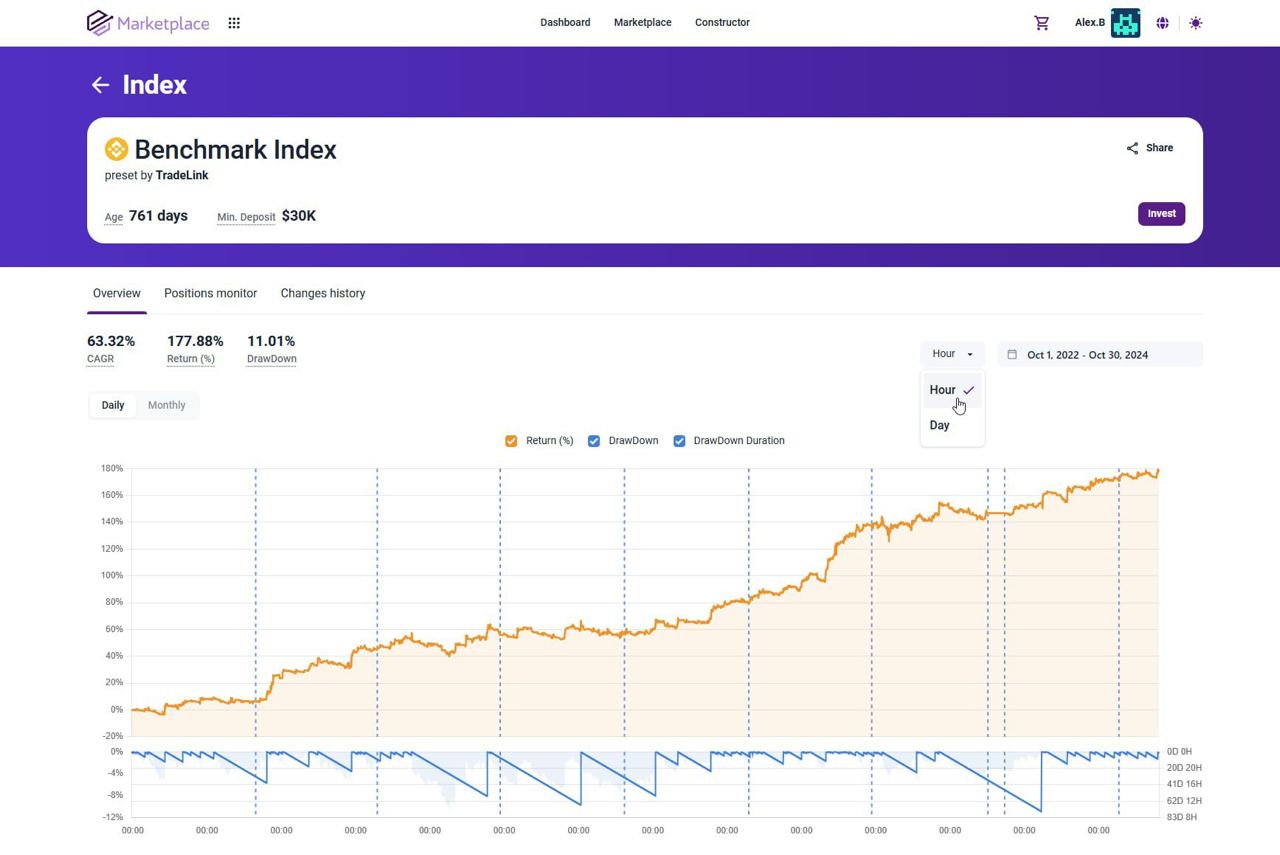
For a long time, we aimed to find a way to display the drawdowns of marketplace indexes with the highest possible accuracy of an hour. After extensive discussions about the technical implementation of this idea, which is crucial for the marketplace transparency, we nevertheless began to develop this feature. And this month we’ve finally implemented it! Now you can explore the historical data of each index from the catalog page on an hourly step.
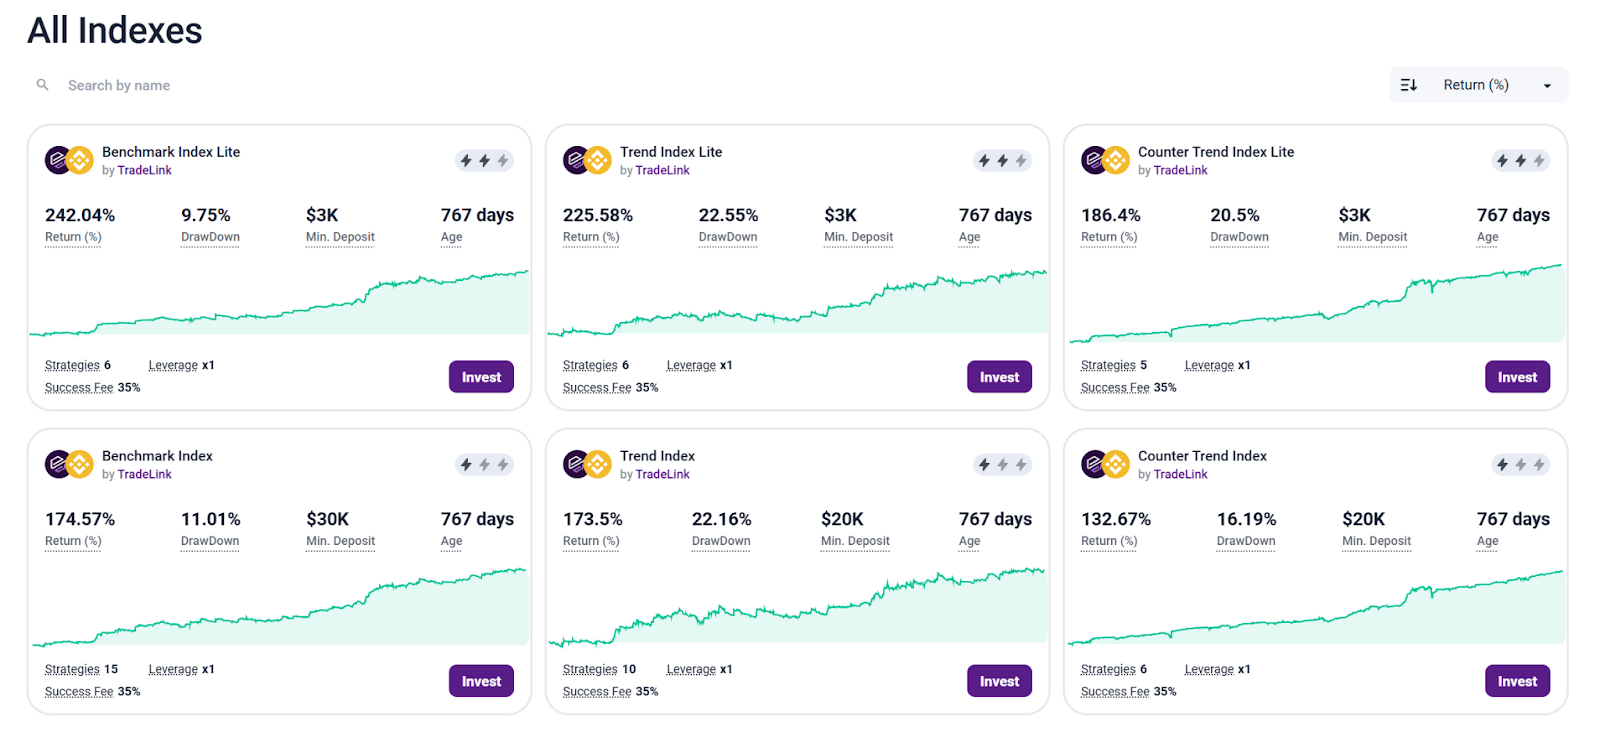
To make the new feature even more useful, we added a step selector to each index, allowing you to choose the desired portfolio display format.
What does this mean for you as a user?
Drawdowns on key marketplace indexes are now calculated 24 times more precisely. Before this update, any intraday index drawdown was not visible on the “Max Drawdown” indicator, as the drawdown was only calculated at the end of the day. Now, drawdowns on all TradeLink indexes are calculated at the end of each hour, allowing for a much more accurate assessment of the investment risks associated with each index. It provides the ability to enable more accurate settings for maximum desired drawdown and make your investment decisions based on more precious data.
We have to mention that unfortunately the new functionality has some limitations:
– We had to limit this feature to six indexes displayed in the main storefront. Custom indexes are still displayed with daily accuracy.
– This feature is not available in the marketplace constructor, where daily precision remains the maximum.
We hope that limitations won’t impair your enjoyment of this feature, and we would love to hear any feedback!
Improved the Dashboard
As you may already have seen, we’ve improved the dashboard on the marketplace to make tracking your investment performance easier. Now it provides even more detailed statistics of your investments, with the new charts, metrics, and indicators.
You can compare the before with after:
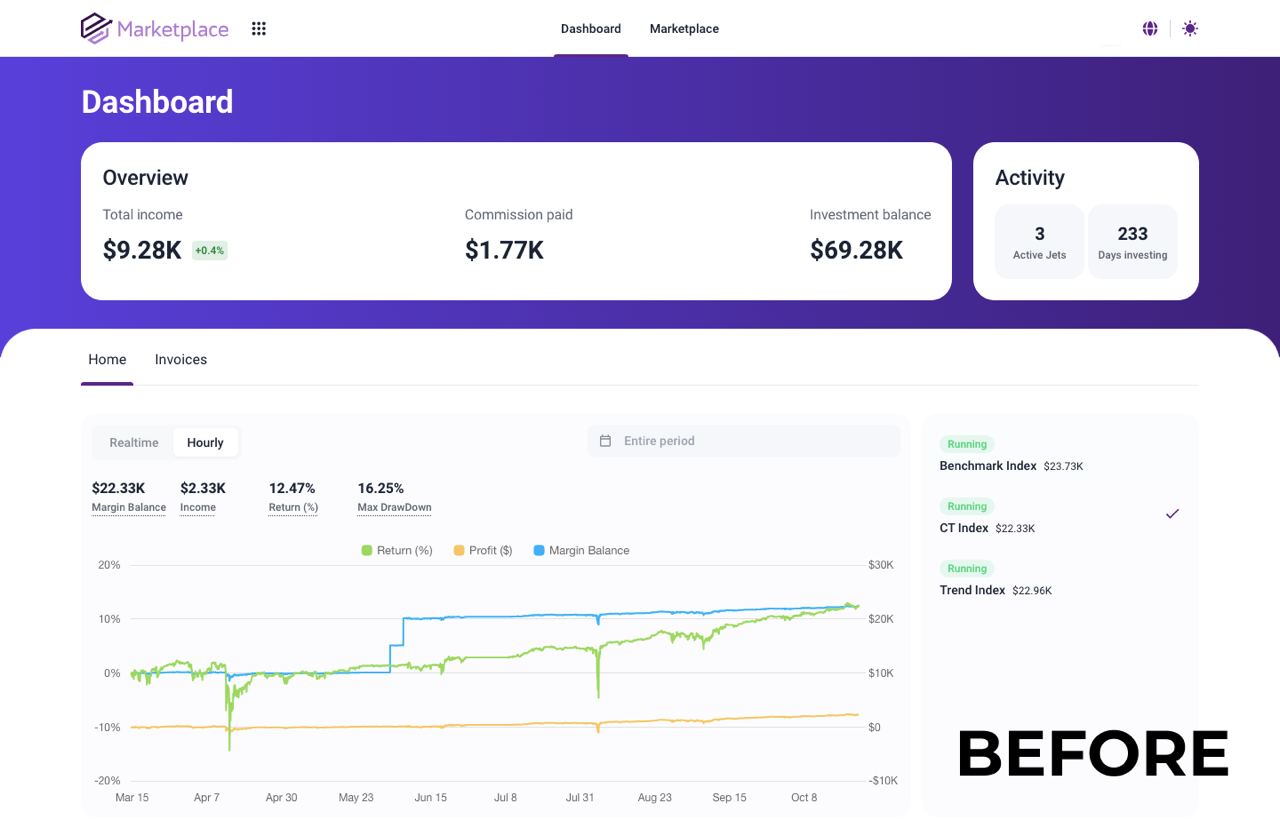
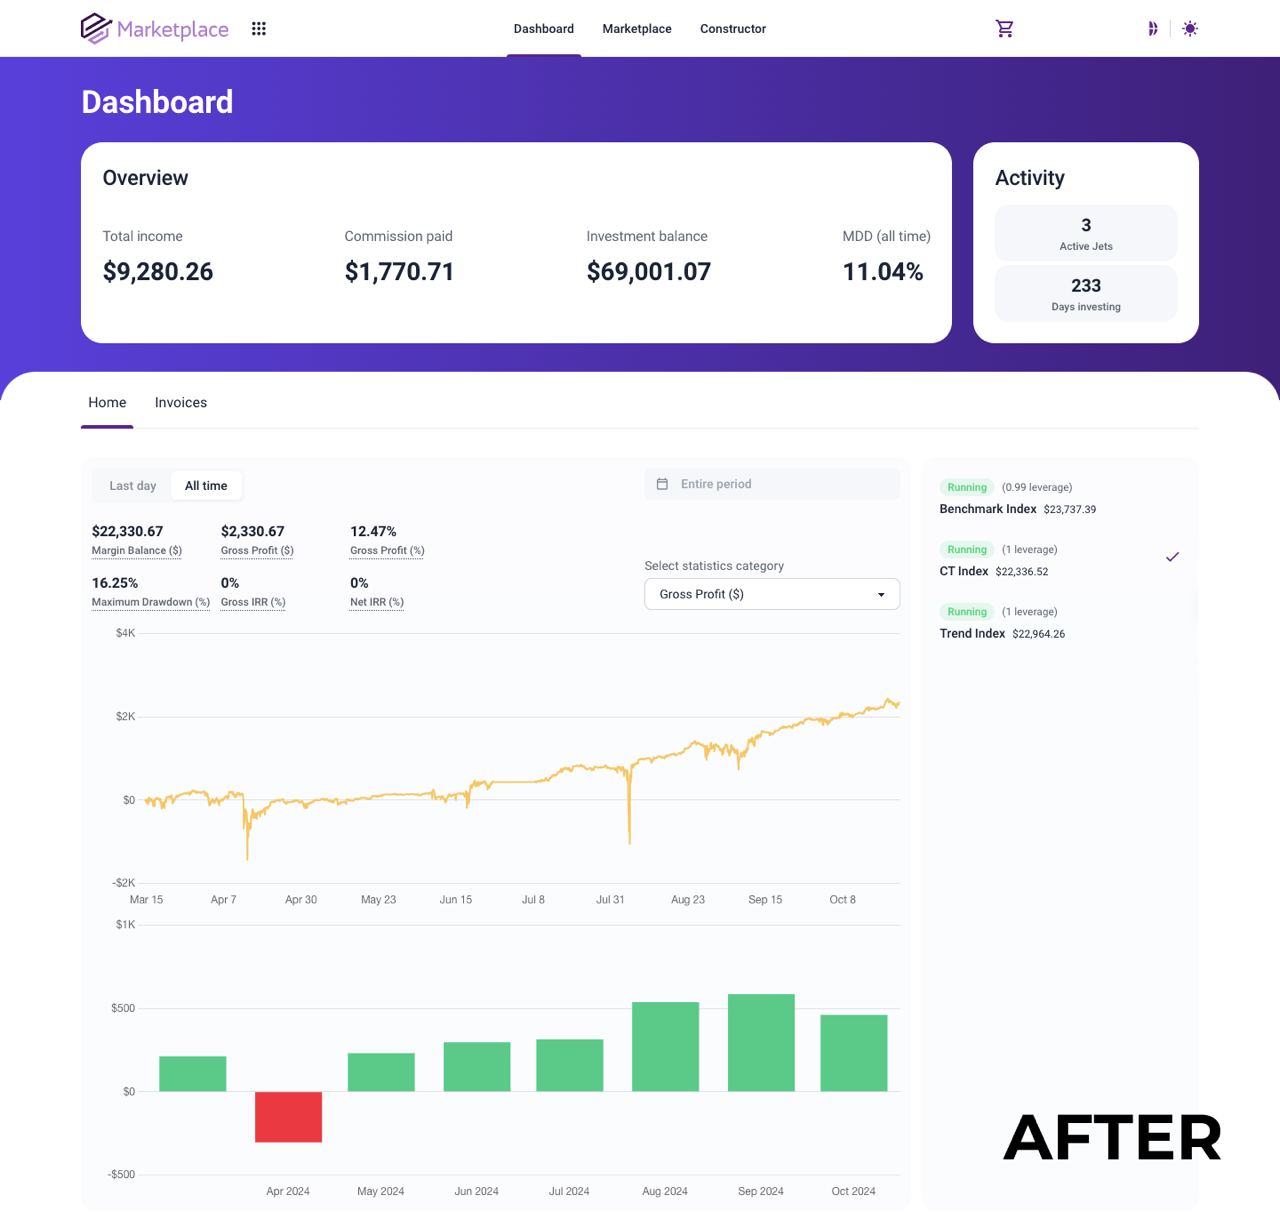
Let’s highlight the key changes:
– Changed chart display logic. You can now select a category of statistics to display, with most categories showing a line chart and a monthly histogram.
– Added new metrics: Maximum Drawdown%, maximum drawdown between all indexes, and Gross IRR with Net IRR (both in dollars and as a percentage)
Gross and net IRR metrics are so important for better insights into returns, that we want to talk about them a bit more. These indicators are familiar in the business sphere for analyzing a product’s investment attractiveness, displaying annualized returns with and without taking into account all commissions.
So now you can view your returns as IRR both before and after TradeLink’s commissions are deducted, as a monthly histogram or a current value.
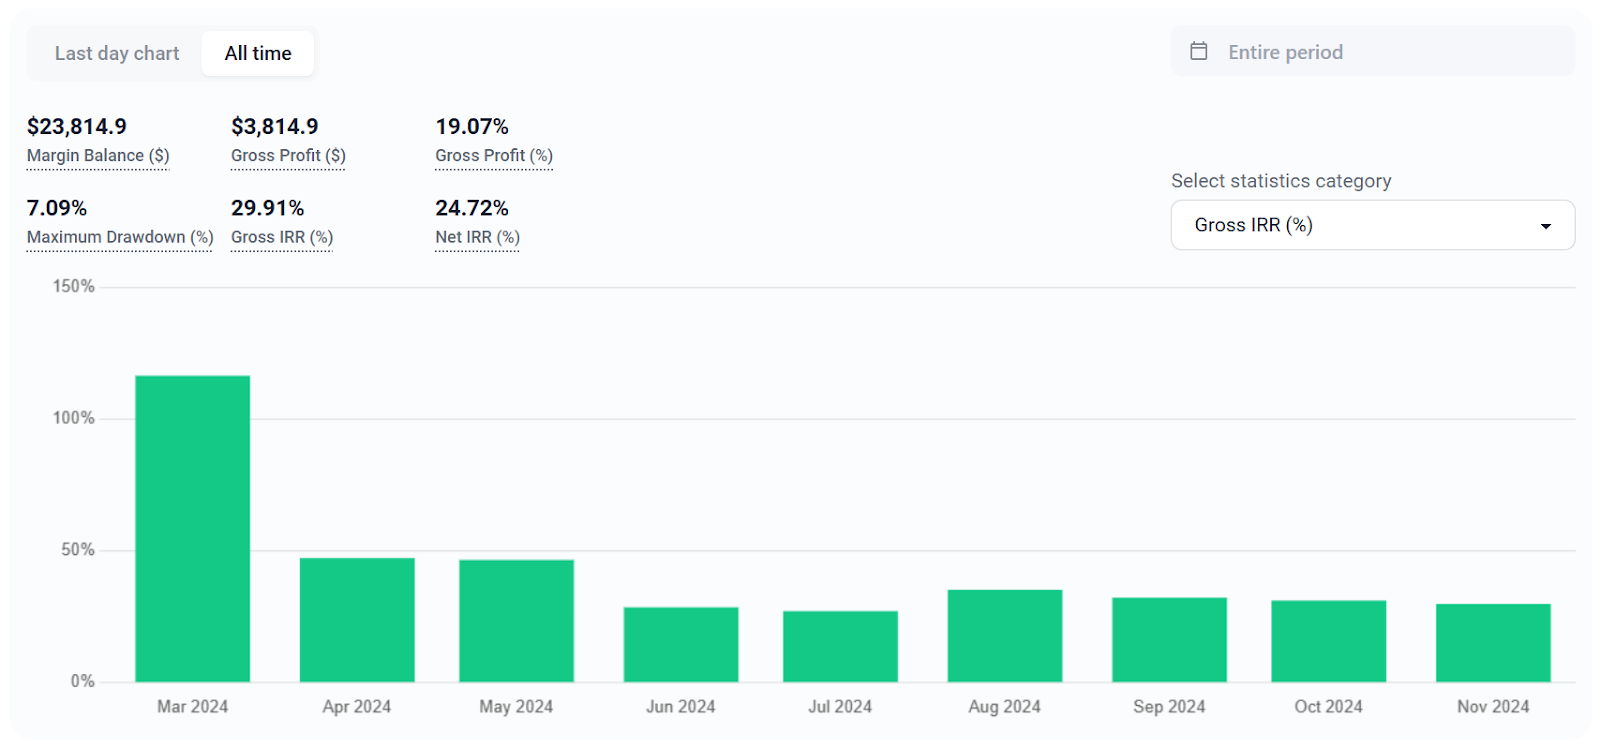
Other updates include choosing which indicators to display and visible leverage sizes for copied indices, giving you a comprehensive view of each specific investment’s metrics. Overall, our dashboard is now more convenient, functional, and informative!
Added BEP20 support
We’ve received a lot of feedback about the inconvenience of using TRC20 USDT for paying commissions for the investment returns. There were several reasons for this, but the main issues were the high transaction fee and the long wait time for transaction confirmation.
To resolve this problem, we’ve added the option to pay marketplace commissions in BSC BEP20 USDT.
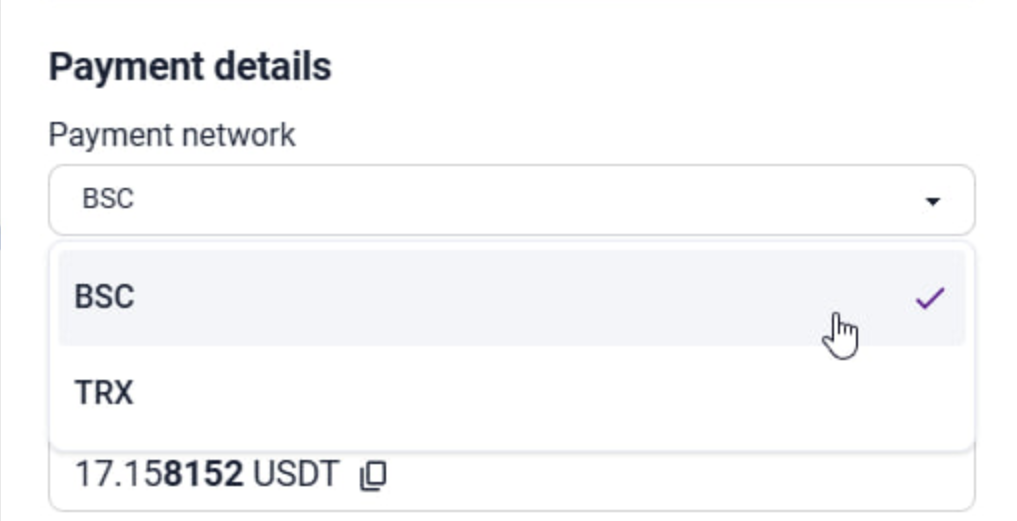
Now, when paying an invoice, you can choose your preferred network for the transfer. You can already try out this feature, and our support team will be happy to assist you with any payment-related questions.
Tradelink Passport Updates:
Began to implement the portfolio sharing improvements
You may not know about this great feature, but we have viral mechanics of portfolio sharing: any link to a TradeLink Passport portfolio shared on major social networks automatically includes a generated image showcasing key portfolio results. It looks something like this:
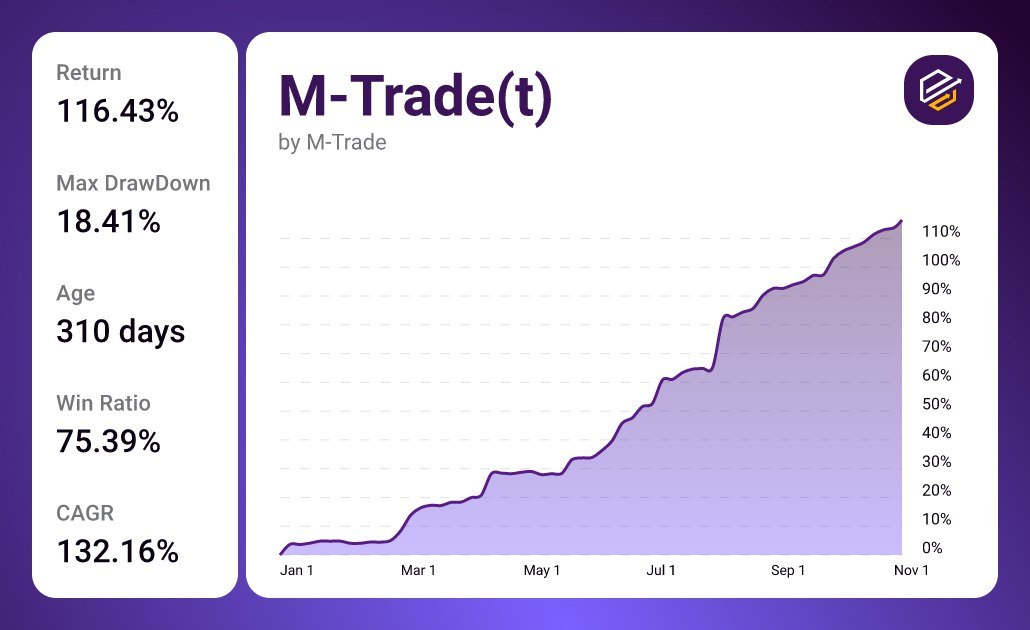
Compared to typical viral previews, our image displays a substantial amount of accurate, high-quality data that allows independent assessment of a trader’s overall profitability.
And the reason why you may not have known about that is the images don’t display when clicking the “share” button on a portfolio or strategy page. We decided to address this problem by reworking the portfolio sharing mechanic.
The portfolio and strategy pages will have an updated “share” button, and the key portfolio indicators and the portfolio’s time range will be more visible with the new shared image:
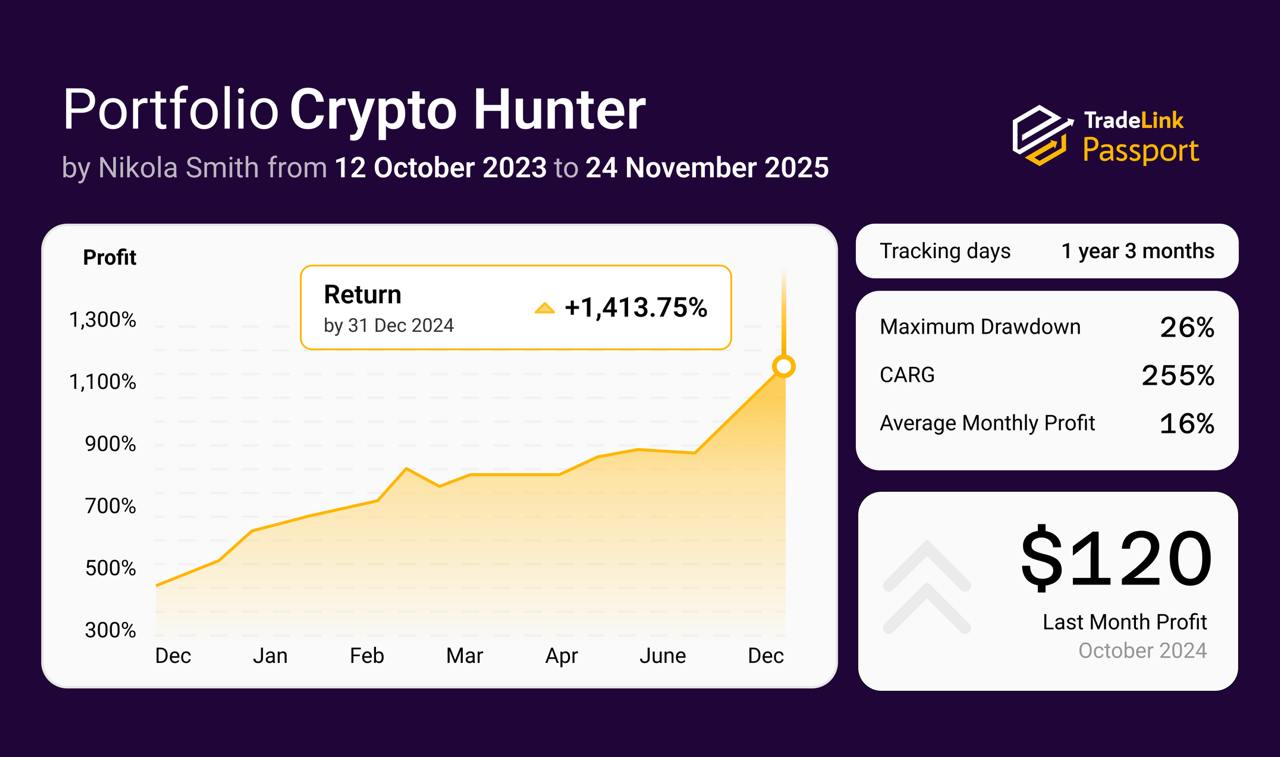
No need to take multiple screenshots – all the important information in one automatically generated image. We can’t wait to deploy this updatement, so you would be provided with the ability to share verified trading performance with ease. Stay tuned!
Overall Platform
We have worked on a lot of things in October to improve your experience with the platform, and tell everything in detail would take a lot of time =)
But we can’t miss mentioning those:
Added a minute chart to the investment portfolio page
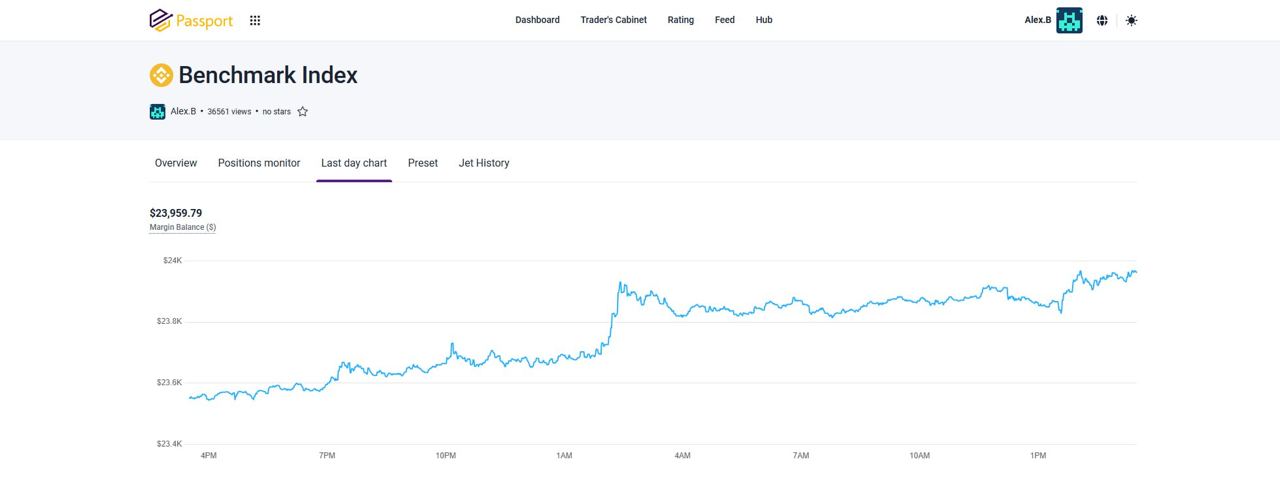
This means that the balance chart of your trading account for the last day is now available not only on the Marketplace Dashboard but also on the investment portfolio page in TradeLink Passport.
Began working on connecting OKX exchange to TradeLink Passport
Tradelink Passport supports major exchanges like ByBit and Binance, but we want to let more traders get full statistics of their trading history and provide our unique tools to help understand and improve their strategy performance. That’s why we are currently working on supporting OKX exchange accounts. So if you trade not only on Bybit or Binance, but OKX too, we think that its connection with our platform will be good news.
Wrote Product Explainers
We found out that many platform’s key features can be missed because they can seem hard to understand. To make them simple and accessible for use, we started to create detailed and visual explainers. You can check some of them and make the most out of our platform’s opportunities:
Explanation of differences between realized and unrealized calculation modelsComplete Guide to the Billing System
We will continue to create more helpful explainers and guides for your seamless use of our products, so don’t miss them by following us on X, YouTube, Linkedin, or Telegram, where we post notifications about any new feature and its complete usage notes.
Well, that’s all for today. But we never stop brainstorming and implementing ideas to provide a secure, transparent, and efficient platform for all our users. We are very grateful for your interest in the project and will do our best to provide the service you deserve.
See you next month!
With gratitude, The TradeLink Team