How to Properly Analyze Spreads and Market Depth on Exchanges
Contents
- Introduction
- Basic concepts and how they are calculated
- Analysis tools
- Spread analysis methods
- Market depth analysis methods
- Liquidity levels
- Request imbalance
- Practical application examples:
- Manipulations in the glass
- What are fake orders (order spoofing)?
- Fake buy or sell orders:
- How to protect yourself from manipulation?
- 1. Using more sophisticated market analysis tools:
- 2. Responding to trends rather than individual requests:
- 3. Minimizing the impact of manipulations:
- 4. Using algorithms and bots to check requests:
- 5. Monitoring sudden changes in liquidity:
- Practical recommendations
- Conclusion
Introduction
What are spreads and market depth?
The spread is the difference between the buy price and the sell price in financial markets. It is an important indicator of an asset’s liquidity and trading conditions.
Market depth is the volume of buy and sell orders, which reflects the activity and stability of market prices.
Market depth shows how many orders are at different price levels and how quickly the market can absorb large orders without significant price changes.
Analysis of spreads and market depth allows traders and investors to assess the liquidity and volatility of an asset. Spreads serve as an indicator of trading costs: a wider spread means higher entry and exit costs. Market depth analysis helps you predict price fluctuations and adjust your trading strategy based on market activity.
Knowledge of spreads and market depth is useful for both professional traders and investors. Traders use this data to identify short-term trading opportunities, while investors use it to understand asset liquidity and optimize trading decisions. Analysts, in turn, can use this information to build forecasts and evaluate market trends.
Basic concepts and how they are calculated
Spread and its calculation formula
The spread is the difference between the buy price and the sell price in the financial market. This is a key indicator that helps determine the cost of entering and entering the market, as well as the liquidity of an asset. The narrower the spread, the more liquid the market is, and vice versa.
Calculation formula:
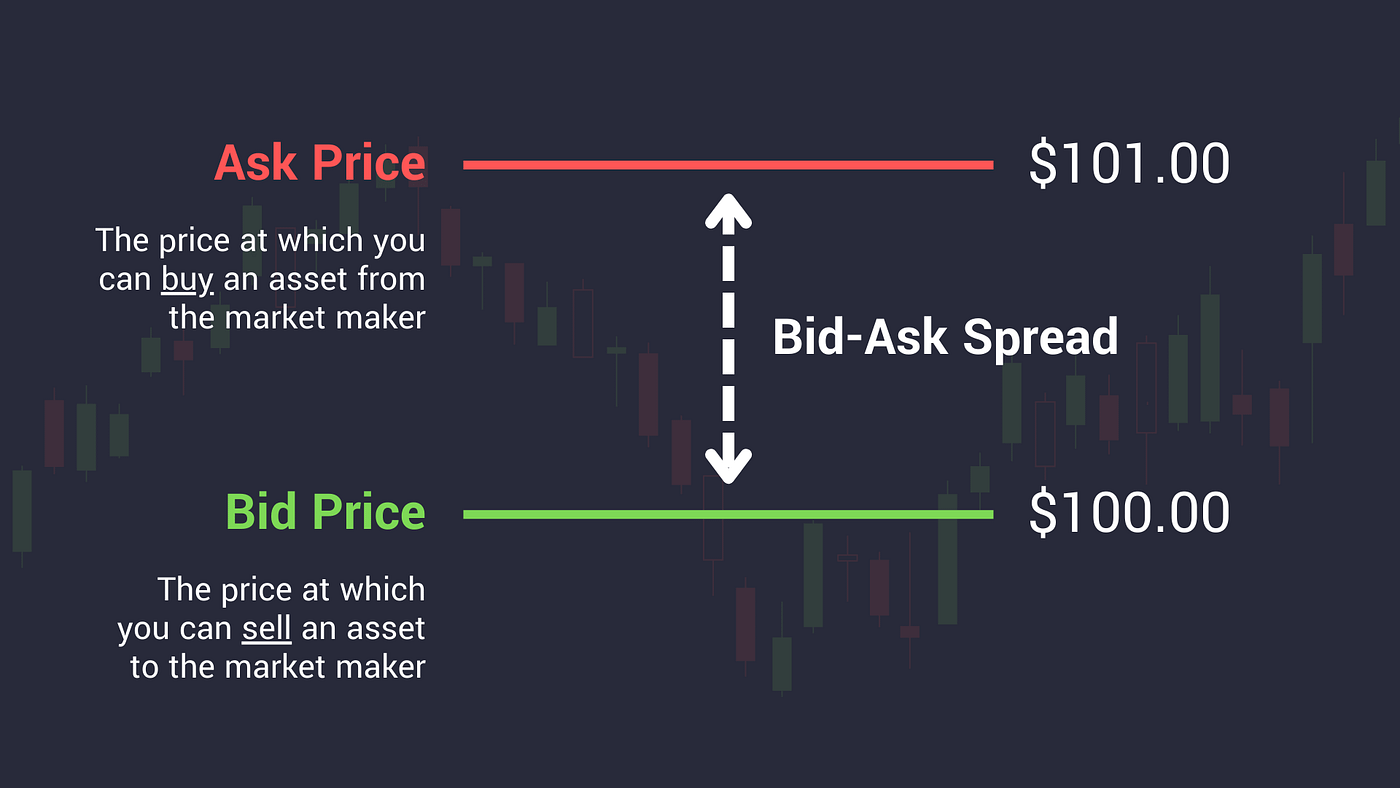
The spread is calculated as the difference between the price at which a trader can buy an asset and the price at which he can sell that asset.
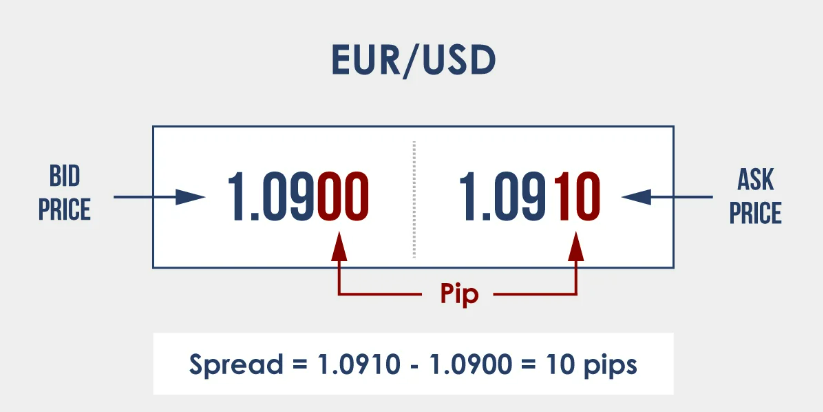
Formula: Spread = Ask Price − Bid Price
Example:
If the buy price of bitcoin is $50,000 and the sell price is $49,950, then the spread will be $50.
Effect of liquidity on the spread size:
Liquidity directly affects the size of the spread. In more liquid markets, where there are a large number of buy and sell orders, the spread is usually small. This is due to the fact that sellers and buyers can easily find each other, and the transaction is completed without significant changes in price.
In less liquid markets, where the number of orders is limited, the spread can be much wider, which means higher trading costs for participants.
Market depth and what it shows
Determining the depth of the market:
Market depth is a measure of liquidity on a particular trading platform, which displays the number of buy and sell orders at different price levels. The more orders placed at certain price levels, the deeper the market is. The depth of the market can be determined using the Order Book.
The depth of the market allows traders to understand how much the market can withstand large volumes of transactions without significant price changes. This is especially important for analyzing volatility and predicting short-term price movements.
What does the application window show?
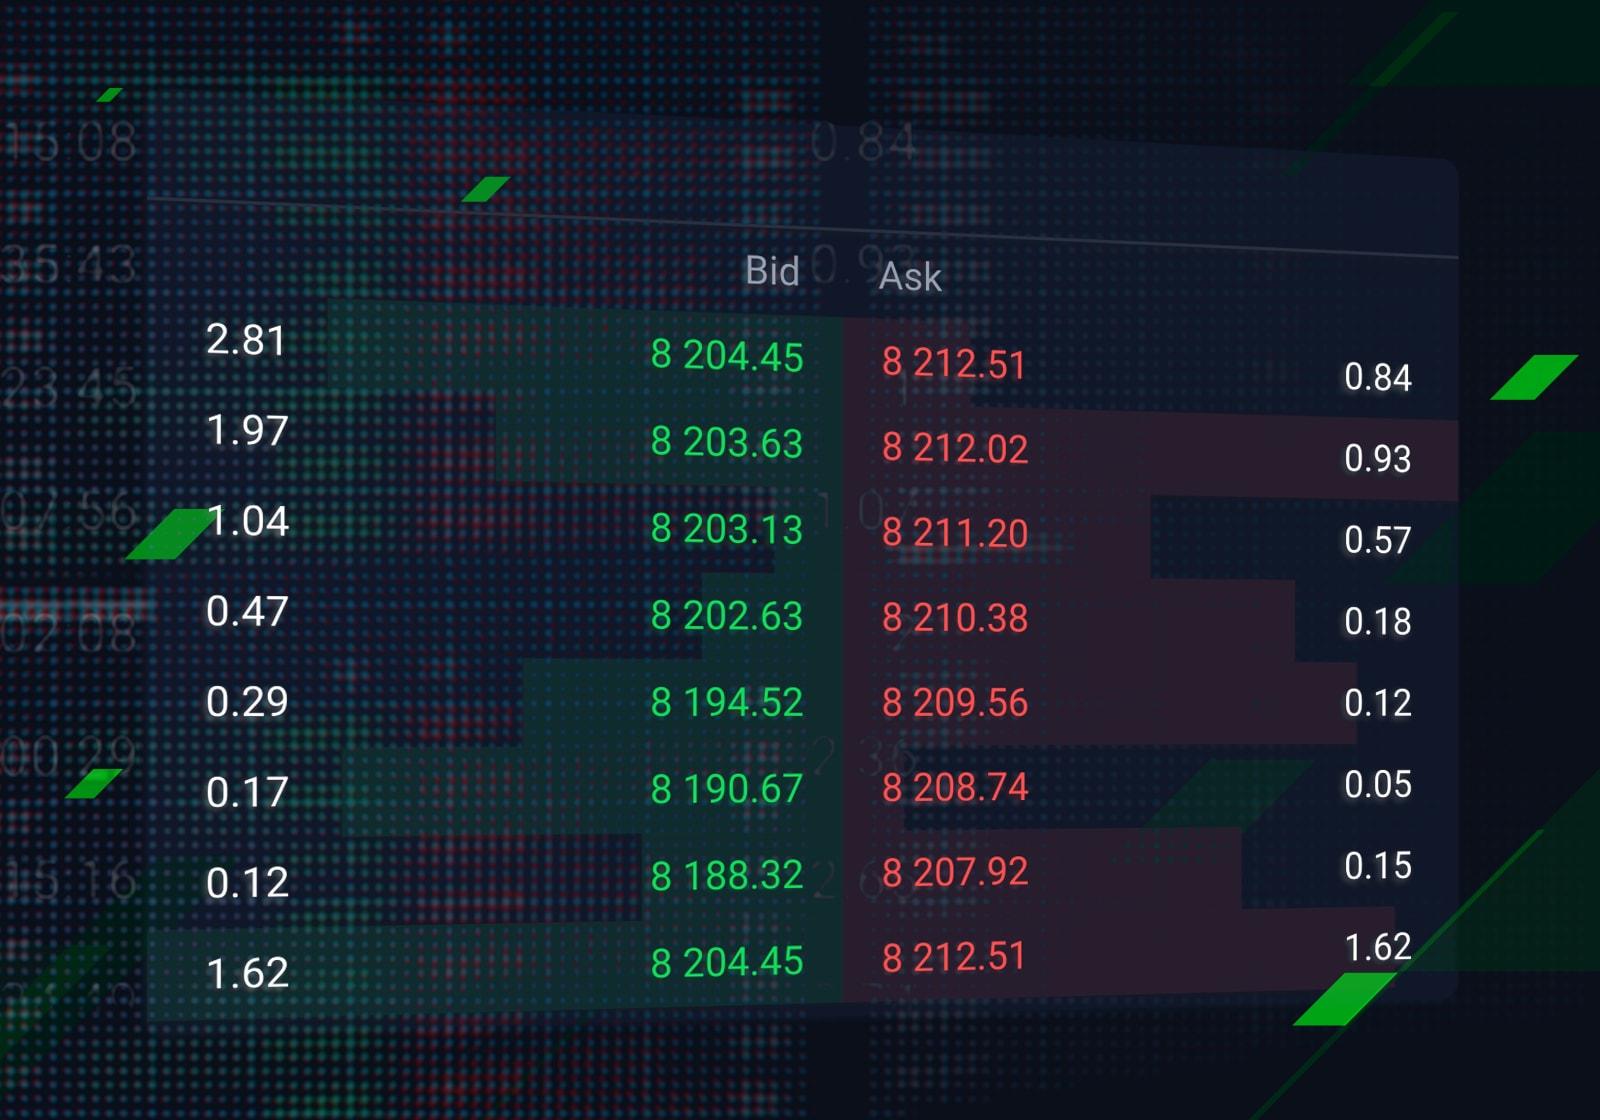
Order Book is a display of all active buy and sell orders that are currently placed on the exchange. It includes two types of orders:
- Bid — buy orders placed at a certain price.
- Ask — orders to sell at a certain price.
The order book provides traders with information about current market levels and helps them understand which price levels can provide support or resistance. It also shows the volume of orders, which gives you an idea of the levels at which large trades can occur.
Impact of order volume on price movements:
The volume of orders at different price levels can significantly affect price movements. If there are many buy or sell orders at a certain level, this can create support or resistance to the price movement. For example, if the price of an asset starts moving in one direction and faces a large volume of orders on the opposite side, this can slow down the movement or even lead to a reversal.
Thus, market depth analysis allows traders to assess potential market stability or weakness at different price levels, as well as make more informed decisions about entering or exiting a position.
Analysis tools
Trading terminals
Trading terminals provide traders with access to a variety of tools for analyzing spreads and market depth.
- MetaTrader:
This is one of the most popular terminals that provides extensive opportunities for technical analysis. It allows you to track changes in spreads in real time and analyze price charts.
- TradingView:
This platform offers powerful tools for graphical analysis, including various indicators and the ability to monitor spreads and order stacks. TradingView supports many cryptocurrency and fiat exchanges, as well as provides interactive charts and market data visualization.
- Other professional terminals
Such as NinjaTrader, Thinkorswim, and Bloomberg Terminal offer unique features for market analysis. NinjaTrader is popular among futures traders due to its advanced tools for market depth analysis and algorithmic trading. Thinkorswim provides powerful stock and derivatives analysis capabilities, including interactive charts and strategies. Bloomberg Terminal, which is used by professionals, provides access to exclusive data, news, and analytics, making it indispensable for institutional investors.
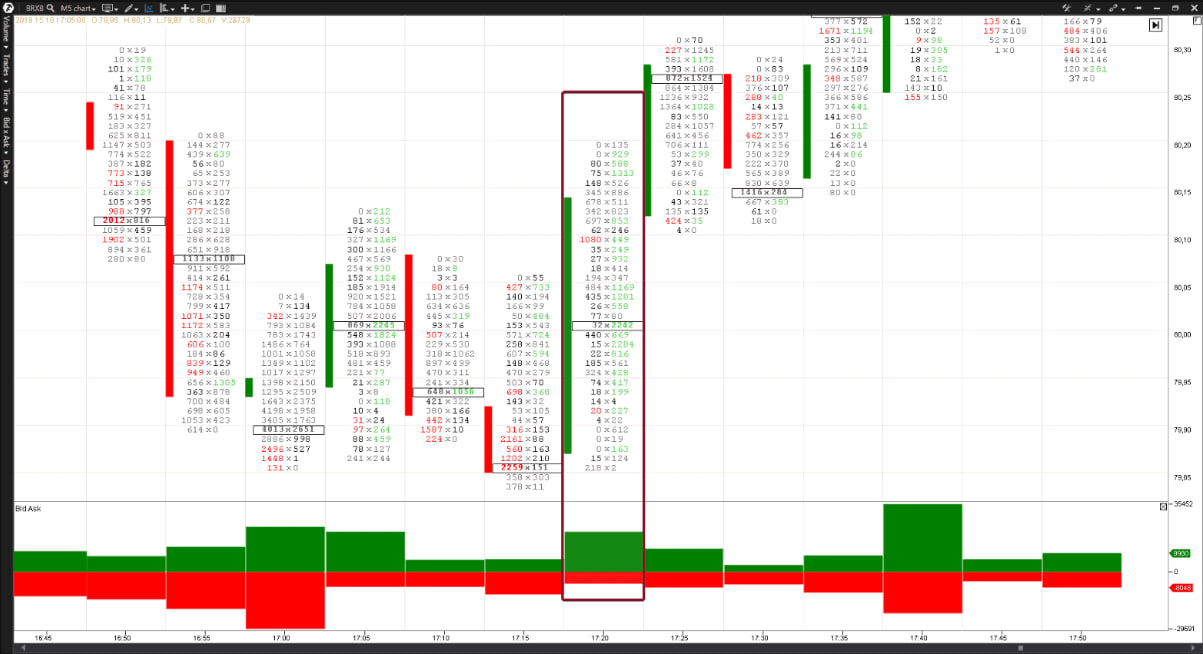
Spread charts and order stacks
Spread charts show the difference between the buy and sell price in real time, which allows you to track liquidity in the market. Charts can show spread changes at different time intervals, which helps traders better understand how liquidity changes depending on market conditions.
Order stacks, as already mentioned, show the volume of buy and sell orders at different price levels. Analyzing bid stacks helps you predict possible price levels where strong price fluctuations may occur.
Using the Exchange API for data analysis
Many cryptocurrency exchanges provide an API (application programming interface) through which you can get data on market liquidity, market depth, and current spreads. Using the API, you can set up automatic tools for monitoring and analyzing spreads and order stacks, which allows traders to collect accurate and up-to-date data to make informed trading decisions.
Examples of popular APIs:
- Binance API
- CoinGecko API
- Kraken API
Using these APIs, you can integrate data on spreads and market depth with your own trading systems or analytical platforms, providing traders with quick access to important information for making decisions.
Spread analysis methods
Spread width
What does a wide or narrow spread mean?
- Narrow spread:
When the difference between the buy price and the sell price is small, this is called a narrow spread. This usually indicates high liquidity in the market, where assets often change owners, and traders can easily make trades with minimal losses on the price difference. Narrow spreads are typical for large, highly liquid assets.
- Wide spread:
When the difference between buying and selling prices is large, this is called a wide spread. A wide spread can mean low liquidity, which makes it harder to make trades at current market prices. It can also be a sign of high volatility or instability in a market where traders expect significant price fluctuations.
How do I interpret the spread values for different assets?
Promotions:
For stocks of large companies (for example, Apple or Microsoft), the spread is usually narrow, since these assets are traded in large volumes, and liquidity is high. For less liquid stocks or small company stocks, the spread may be wider, which means less liquidity and more risk for traders.
Cryptocurrencies:
In the cryptocurrency markets, spreads can be very diverse. Cryptocurrencies with high liquidity, such as Bitcoin (BTC) or Ethereum (ETH), often have narrow spreads, especially on major exchanges. However, for less popular or new cryptocurrencies, the spread can be much wider, as trading volumes are smaller, which increases the difference between the buy and sell price.
Futures:
In the futures markets, especially for popular contracts such as oil or gold futures, spreads tend to be narrow. However, on less liquid futures contracts (for example, for rare commodities or contracts with a small trading volume), the spread may be wide, which is associated with a smaller number of participants in the market.
Dynamics of spread changes
How do I respond to changes in the spread in real time?
Spread changes can occur quickly, especially in highly volatile environments or during significant market events. It is important for traders to monitor the spread dynamics in order to make informed trading decisions:
- Narrow spread:
When the spread gets narrower, it usually means more liquidity. Traders can take this as a signal to make trades, as it is more profitable to enter and exit with minimal losses on the spread. However, you should be careful, because such a reduction may be short-term and the spread may widen again if liquidity decreases.
- Wide spread:
When the spread becomes wider, it signals a decrease in liquidity, which may be due to a certain instability in the market. In this case, traders can refrain from making trades or use strategies designed to minimize the impact of an extended spread, such as waiting for liquidity to return or adjusting positions.
Impact of news and events on the spread
News and events play an important role in changing liquidity and, consequently, spreads. The impact of news on the market can be both short-term and long-term and often manifests itself through changes in spreads:
- Economic news:
Announcements about macroeconomic data, such as interest rates, inflation, and employment, can lead to a sharp widening or narrowing of spreads. For example, after the release of important economic reports, liquidity may increase sharply, which will lead to a reduction in spreads. On the contrary, during periods of uncertainty, spreads can widen.
- News about regulations:
Government decisions to regulate cryptocurrencies, stocks, or other assets often lead to dramatic changes in liquidity and can cause both widening and narrowing spreads, depending on how market participants perceive the news.
- Political events:
Elections, instability in government structures, or geopolitical events can cause a wave of uncertainty, which will lead to widening spreads. Investors and traders will be more cautious, which will reduce liquidity and increase the difference between the buy and sell price.
- Company News:
For stocks or cryptocurrencies associated with a particular company or project, corporate news such as earnings, mergers, or bankruptcies can instantly change liquidity and cause the spread to change.
Therefore, spread changes are often the result of external factors such as news and market events, and traders should be prepared to adapt quickly to these changes in order to minimize risks and generate profits.
Market depth analysis methods
Liquidity levels
How do I identify strong and weak support and resistance levels?
Support and resistance levels are key concepts for traders that help them analyze price behavior in the market. These levels can be determined by analyzing the market’s liquidity and depth:
- The support level is the price level at which an asset is experiencing increased demand and cannot go lower as buyers begin to enter the market. It most often corresponds to the point where a high volume of buy orders is accumulated. To determine it, it is important to analyze where the greatest accumulation of buy orders is observed, as well as where the price previously stopped and bounced up.
- A resistance level is a price level at which an asset faces a strong seller, which prevents further growth. It is important to look for those zones where large sell orders are located and where the price could not break this level in the past. These levels will signal places where the market is oversold or where there is a lot of interest from sellers.
To accurately determine support and resistance levels, traders often use a combination of historical data, order stack analysis, and technical indicators. Often, traders add volume zones to this to confirm the presence of strong levels. For example, using volume indicators
Distribution of large orders in the stack
The depth of the market, or order book, shows not only the current purchase and sale prices but also how the orders are distributed by price. To see the strong and weak support and resistance levels, traders analyze a glass of orders:
- Large purchase orders:
If there are many large buy orders at a certain price level, this may indicate a strong support level. The larger the volume of purchases, the less likely it is that the price will break through this level.
- Large sales orders:
When there are large sell orders at a certain price level, this can serve as a signal of a strong resistance level. Such levels usually indicate high liquidity, and traders expect that the price will not be able to easily overcome this level without considerable effort.
Thus, the analysis of the distribution of large orders in the stack helps to identify areas with high interest from buyers and sellers, which allows you to more accurately determine the levels of support and resistance.
Request imbalance
How does the imbalance between buyers and sellers affect the price?
An imbalance between buyers and sellers is a situation where the number of orders to buy or sell at different price levels differs significantly. This imbalance can greatly affect the price movement of the asset.
- If there are more buyers than sellers:
When there is an excess of buy orders in the market compared to sell orders, this usually leads to an increase in the price. Demand prevails, and the price moves up as buyers are willing to offer higher prices to make deals.
- If there are more sellers than buyers:
When there are more sell orders than buy orders in the market, there is pressure to lower the price. Sellers are forced to lower the price in order to find a buyer, which leads to a drop in the value of the asset.
- Market with a balance of orders:
When the number of buy and sell orders is approximately the same, the price is usually stable and does not change dramatically until there is a significant change in one of the parties.
Practical application examples:
Imbalance at the level breakdown stage:
When the price approaches a support or resistance level, it is important to monitor the imbalance between buyers and sellers. For example, if there is a significant imbalance towards sellers at the resistance level (there are many sell orders), then attempts to break through this level will be more difficult, and the price is likely to rebound. On the contrary, if the resistance level “weakens” due to a shortage of sell orders, a breakdown of the level can lead to an increase in the price.
Algorithmic trading:
In algorithmic trading, such as scalping strategies, traders monitor the order imbalance to find optimal entry and exit points. If buy orders start to prevail, and this is accompanied by a rapid increase in the price, bots can open long positions (purchases).
Situations with a sudden surge of interest:
An example of a practical application can be a news item that causes a sharp interest among buying investors. If news (for example, about a company’s partnership or the development of a new product) causes a sharp increase in purchase requests, an imbalance appears in the glass in favor of customers. The price of assets will start to rise as buy orders remain unfulfilled until sellers can balance demand.
Thus, understanding and analyzing the order book imbalance allows traders and investors to see short-term price fluctuations and effectively work with market liquidity.
Manipulations in the glass
What are fake orders (order spoofing)?
Fake orders are a manipulative practice in the financial markets, in which a trader or group of traders places large buy or sell orders in the order book, without any intention of executing them. These orders are created in order to influence the perception of liquidity in the market and force other participants to respond to false signals.
Fake buy or sell orders:
For example, a trader can place a buy order at a price level significantly higher than the current market price or place a sell order significantly lower than the market. This creates the appearance of high liquidity at these levels and can lead to a change in the behavior of other market participants, who may begin to adjust to these levels, which can lead to sharp price fluctuations.
How to protect yourself from manipulation?
1. Using more sophisticated market analysis tools:
One of the ways to protect yourself from manipulation is to use advanced tools to analyze the order book, which helps you identify abnormal order volumes or unusual changes in buy and sell orders. Programs like Market Depth or Order Book Visualization can help traders see potential manipulations and distinguish them from actual market orders.
2. Responding to trends rather than individual requests:
Instead of keeping track of individual orders, it is wise to focus on larger market trends so as not to get caught up in manipulation. This includes the use of technical indicators such as moving averages, support and resistance levels, so as not to depend only on the data of the stack.
3. Minimizing the impact of manipulations:
It is important not to make decisions based on one factor, especially if a “suspicious” request appears in the glass. Traders and investors should stay away from an asset that is often subject to manipulation, or use restricted orders to minimize the risk of falling into a trap.
4. Using algorithms and bots to check requests:
Algorithmic trading systems can be configured to exclude manipulation of orders by filtering fake orders or excluding them from calculations. Some more sophisticated trading strategies can analyze the current state of the stack and discard questionable data for more accurate forecasting.
5. Monitoring sudden changes in liquidity:
It is important to monitor sudden changes in liquidity, for example, when a large number of orders appear in the glass in a short period of time, which then quickly disappear. This can be a sign of manipulation, and the trader should take action, such as reducing the size of trades or rejecting orders placed at suspicious levels.
The task of such manipulations is to create the illusion that, at certain levels, the price will be delayed due to huge orders. As soon as other traders start to react, the trader who placed fake orders removes them, getting the opportunity to open or close a position profitably.
Practical recommendations
In this section, we will look at some practical recommendations that will help you effectively use information about spreads and market depth when trading various assets. Understanding these aspects will allow you to significantly improve the accuracy of your decisions and increase the profitability of your trades.
Which assets are easier to analyze?
Analysis of spreads and market depth is most easily performed in active and liquid markets. These assets include:
- Popular cryptocurrencies — they have high liquidity and often have a narrow spread, which makes analysis easier.
- Stocks of large companies — they are also characterized by good liquidity and often have accessible and transparent data for analysis.
- Futures contracts for index assets — these instruments are also popular, liquid, and highly active in the market.
It is more difficult to analyze spreads and market depth on less liquid and low-active assets, where spreads can be wide, and liquidity data is less accurate.
How can I use spread analysis and market depth to select a strategy?
- For scalping:
Scalping requires a quick response to small price movements. Therefore, assets with a narrow spread and high liquidity are especially important for this strategy. By analyzing market depth and spreads, a scalper can gain an advantage in entering and exiting trades quickly, minimizing spread costs. It is important to monitor the spread dynamics in real time to avoid high transaction costs.
- For swing trading:
Swing traders are guided by longer-term trends, so they should pay attention to the stability of liquidity and patterns in the spread change. Swing traders can use a deep analysis of the order book to identify support and resistance levels that may indicate possible market reversal points.
- To invest in:
Investors can use spread analysis and market depth to make a long-term selection of assets with good liquidity, which is important for their ability to buy and sell in the future with minimal costs. Strong long-term liquidity levels help avoid sharp price fluctuations and hidden risks.
Common analysis errors and how to avoid them
Mistake 1: Ignoring liquidity
Often traders do not pay attention to the liquidity of assets, which can lead to significant losses, especially in large transactions. To avoid this mistake, always check not only the spread, but also the depth of the market to understand how easy or difficult it will be to execute a trade at the desired level.
Mistake 2: Expecting spread stability in a volatile environment
In times of high volatility, spreads can widen significantly. Traders who expect a narrow spread in such conditions may find themselves at a disadvantage. To avoid this mistake, it is important to constantly monitor changes in liquidity and adapt the strategy in a volatile market.
Mistake 3: Ignoring fake requests and manipulations
A lack of attention to possible manipulations in the order book can lead to incorrect decisions. Use tools to filter out false orders and pay attention to abnormal changes in liquidity to avoid falling into the trap of fake orders.
Mistake 4: Inability to adapt to changing market conditions
Markets are always changing, and a strategy that works in some conditions may not work in others. Constantly monitor changes in liquidity and adapt your trading strategy based on current market conditions.
Knowing how to interpret this data correctly helps you avoid unnecessary risks and choose the most profitable trading strategies.
Conclusion
Analysis of spreads and market depth is an essential tool for traders and investors seeking to trade successfully in the financial markets. Understanding this data allows you to make better informed decisions, identify liquidity and market manipulation, and adapt your strategy to current market conditions. The use of spreads and order stacks offers significant benefits, whether for scalping, swing trading, or long-term investing.
However, it is important to keep in mind the possible risks and errors that may occur if the data is misinterpreted.