How to Use Cryptocurrency Volatility for Short-Term Trading
Contents
- Introduction
- What is cryptocurrency volatility?
- Benefits of volatility for short-term trading
- Risks of trading in volatile markets
- Short-term trading strategies in volatile markets
- Using technical analysis to work with volatility
- Recommendations for novice traders
- Tools for dealing with volatility
- Conclusion
Introduction
The cryptocurrency market is famous for its high volatility, which makes it attractive for traders focused on short-term trading. However, trading in a volatile market requires knowledge, experience, and discipline. In this article, we will analyze in detail what volatility is and what strategies exist for using the volatility of cryptocurrencies in short-term trading.
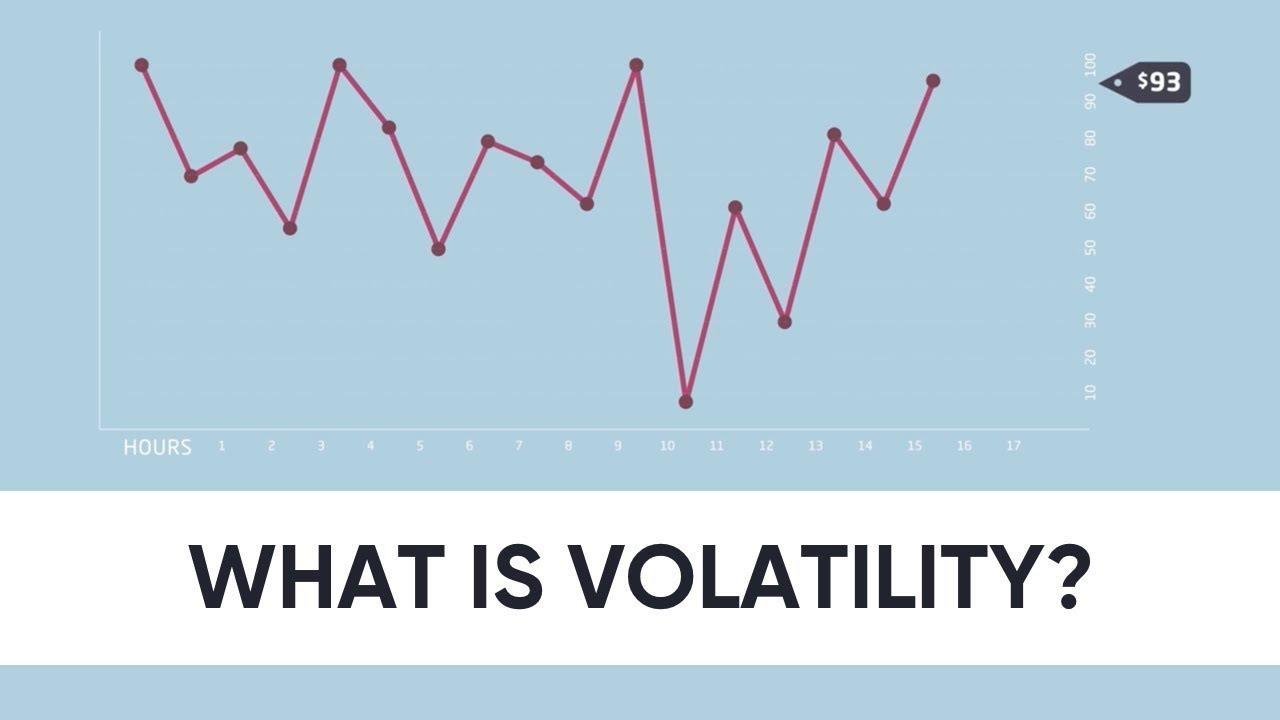
What is cryptocurrency volatility?
Volatility is an indicator of the price variability of an asset over a certain period of time. High volatility is typical for assets whose prices can change significantly in a short period of time, while low volatility is typical for more stable assets. Simply put, it is a measure of the speed and scale of price changes in any market.
In the cryptocurrency market, the volatility is much higher than in traditional financial markets. Here are the main factors affecting volatility:
- News and events. Cryptocurrencies are extremely sensitive to information issues, as for example, against the background of Elon Musk’s statement about Tesla’s refusal to accept bitcoins, the bitcoin exchange rate sank immediately by 15%.
- Regulatory changes. A ban on cryptocurrencies or their use, for example, in China, often causes a decline in prices, and the legalization of cryptocurrencies in certain countries or the recognition of their assets increases the interest of investors.
- Psychology of the market. The cryptocurrency market is often dominated by emotions, which increases the amplitude of price fluctuations. For example, a sharp drop causes fear, forcing participants to sell assets.
It is important for traders to understand the nature of volatility in the cryptocurrency market and take it into account in their strategies. Volatility in the crypto market is both a risk and an opportunity.
Benefits of volatility for short-term trading
It is short-term trading that allows you to get the maximum benefit from the high volatility in the crypto market. The main advantages that make volatility attractive for active trading are:
- The rapid growth of profit potential
The high amplitude of price fluctuations allows traders to make money on significant movements in a short time: quickly enter the market and take profits on sharp price jumps. For example, within one day, the price of a cryptocurrency can change by 10-20% or more, and the trader makes a profit from this with the right strategy.
- More features
In a volatile market, price movements occur more frequently, which creates more entry and exit points for trades. Traders can use a variety of trading strategies, as well as work on different timeframes: from minute to hour charts
- Low entry threshold to start trading.
The cryptocurrency market is open to traders with any level of capital. Unlike traditional financial markets, crypto exchanges allow you to start trading with minimal amounts, and the use of leverage increases the available amount of capital.
The high volatility of the cryptocurrency market creates excellent conditions for short-term trading.
However, it is important to keep in mind that high volatility also increases risks, so we will analyze the risks of trading in volatile markets later.
Risks of trading in volatile markets
In general, trading in volatile markets, including cryptocurrencies, is associated with a high level of risk. Despite the possibility of significant profits, traders should consider the following main threats:
High probability of losses
Volatility, which creates opportunities for earning money, simultaneously increases the probability of significant losses. Rapid price changes can suddenly go against the trader’s expectations, and the use of high leverage also increases the size of the losses themselves.
Alternatively, for people who do not want to take on big risks, there is a platform with investing in risk-resistant crypto indices, compiled from the strategies of the best algorithmic traders.
TradeLink is an investment platform in crypto indices without transferring funds to management, as well as with the ability to regulate risks.
Trader’s Emotional stress
Rapid price changes due to high volatility put significant psychological pressure on the trader. How exactly this manifests itself:
- FOMO (fear of missing an opportunity): Traders feel that they have missed an opportunity to make money and, against this background, make hasty trades, trying to catch the movement.
- Panic: A sharp drop in the price causes fear and unreasonable selling decisions.
- Overtrading: The desire to compensate for losses leads to the fact that the trader begins to overestimate the risks, which accordingly leads to even greater losses
For example, a trader who sees rapid growth of an asset may buy it at a high price, fearing to lose profit, but if the trend reverses, incur losses due to an unprofitable entry point.
Loss of liquidity in extreme situations
In extreme market conditions, such as a sudden collapse in prices or a massive sell-off, liquidity can quickly shrink or disappear altogether. Which can lead to:
- Difficulties in closing a position at the desired price.
- Increase the spread between the buy and sell price.
- The occurrence of slippage (execution of an order at a worse price than expected).
Therefore, avoid trading during high uncertainty, such as after the release of important news, and choose liquid assets and exchanges with high trading volume.
To minimize risks, traders need to use money and risk management strategies, adhere to the trading plan, and pay attention to psychological stability.
Short-term trading strategies in volatile markets
There are several strategies for short-term trading in volatile markets. Among the most popular strategies:
Scalping
Scalping is a strategy based on making a profit from small price fluctuations in a short time.
The special features of this strategy are that it is best suited for assets with high liquidity and volatility. Traders make a lot of trades per day, taking profit from each trade using this strategy.
Suitable tools and indicators:
- Indicators:
- Average passing volume – for sorting requests in a stack
- Open interest – to measure trading activity in the market
- Correlation - the relationship of the price of bitcoin with a particular coin
- Tools:
- A glass of limit orders and a feed of trades to track market dynamics.
- Charts with timeframes of 1 and 5 minutes.
For example, a trader sees on a 1-minute chart that the price of an asset touches the support level several times and quickly bounces. And the trader, buying an asset in the support zone, makes a profit when the price bounces.
Trading on the breakdown of levels
This strategy is based on trading at the moment when the price breaks through key support or resistance levels.
Identify key support and resistance levels:
- Support levels are price points where the asset previously found demand and the price bounced up.
- Resistance levels are areas where supply dominates, stopping price growth.
Using Breakout signals:
- Wait for confirmation of the breakout (the price closes outside the level).
- Analyze trading volumes — high volume confirms the breakout.
It is important to remember that there are also false breakouts when the price removes liquidity behind the levels and returns to the previous range. It is always necessary to take risks into account when making transactions.
Arbitrage between exchanges
Arbitrage is a strategy in which traders profit from the difference in prices of the same asset on different platforms.
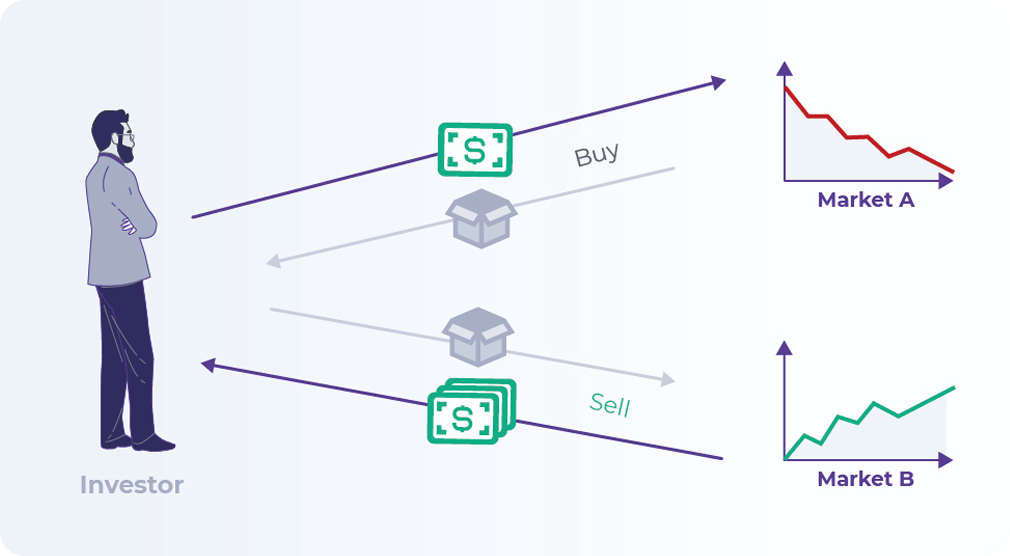
How to profit from the price difference:
The price difference occurs due to:
- Different liquidity of exchanges.
- Slow market reaction to news events.
A trader buys an asset on an exchange with a lower price and sells it on a platform with a higher price.
Examples of successful arbitration:
Classic Arbitration:
On exchange A, bitcoin is worth $29,900, on exchange B - $30,000. Buying on A and selling on B makes $100 profit.
Arbitrage in a pair of assets:
Price difference between related assets. For example, ETH/USDT on one exchange and ETH/BTC on another.
Each strategy requires careful preparation, market analysis, and risk management to be applied successfully.
Using technical analysis to work with volatility
Technical analysis helps people understand price movements based on historical data about price, trading volume, and market indicators. Using specialized indicators and analysis methods, you can evaluate the volatility for further work.
Indicators for assessing volatility:
Bollinger Bands - Bollinger Bands
This indicator measures volatility using the standard deviation of the price from its moving average.
The indicator itself consists of three lines:
- The average line is a simple moving average (usually 20-day).
- Upper and lower bounds — are located at a distance of two standard deviations from the average.
If the bands widen - > the market becomes more volatile, and if the bands narrow - > volatility decreases, future momentum is possible.
In practice, if the Bollinger Bands have sharply narrowed and the price is approaching the lower limit, this may signal an imminent change in the trend and an increase in volatility.
ATR (Average True Range) — Average True Range
ATR measures the average range of price movement over a certain period and is mainly used to assess volatility. It is calculated as the average value of the true price range for a certain number of periods (usually 14).
And if:
- The ATR is growing, which indicates an increase in volatility.
- The ATR is falling, and the market is becoming less volatile.
For example, if the ATR has increased sharply after a prolonged decline, this may indicate the beginning of an impulse movement.
CVI (Crypto Volatility Index) - Cryptocurrency Volatility Index
This index reflects the degree of uncertainty in the market and helps to assess the level of fear or greed among market participants.
CVI is based on asset data and historical volatility, and the higher the index value, the more volatile the market is.
With a high CVI (>70), investors can expect increased market turbulence and an early correction, while a low CVI indicates stability but may precede a period of high volatility.
Volume and candle pattern analysis
An important part of technical analysis is volume analysis and candle patterns. Traders use it to determine the strength of price movement, find entry and exit points, and filter out false signals.
Volume analysis
The trading volume reflects the interest of buyers and sellers of the asset. They show the number of assets that were bought and sold over a certain period of time. The relationship between volume and price movement helps determine the strength of the trend and the probability of its continuation or reversal.
Examples of volume indicators:
- OBV (On Balance Volume) — shows the accumulation or distribution of the asset.
- Volume Profile — horizontal volume. Indicates are the levels at which the price was traded most often.
- VWAP (Volume Weighted Average Price) — the weighted average price by volume.
Candle patterns
Candle patterns are well-established patterns of candle placement. In other words, repeated formations of candle combinations play an important role in making informed trading decisions.
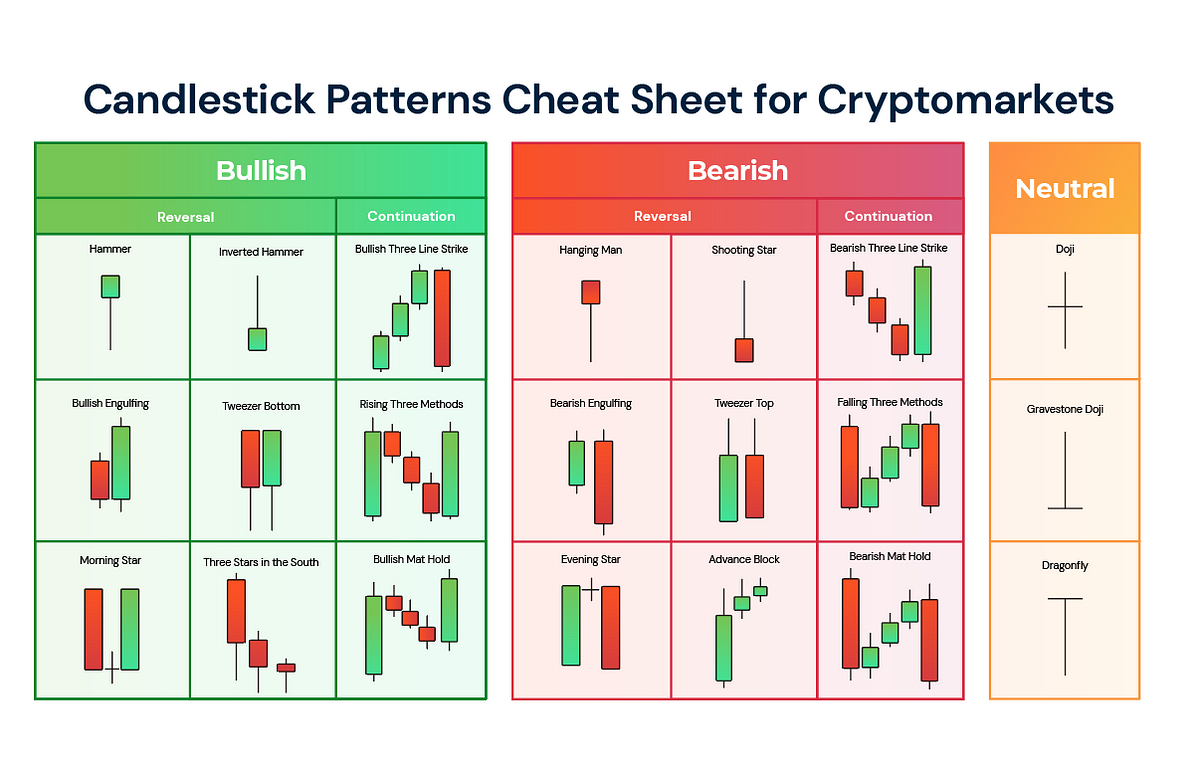
Although patterns help determine the main price movement, you should not make a trading decision based on them alone.
Recommendations for novice traders
It is especially important for beginners to develop a clear trading plan, adhere to discipline and a money management strategy in order to minimize losses and increase the likelihood of successful trades.
Develop a clear trading plan.
Before starting trading, it is important to determine:
- Trading strategy: whether it’s scalping, intraday trading, breakout trading, etc.
- Criteria for entering and exiting a trade: based on certain indicators, patterns, key levels, or areas of interest.
- Risk management: maximum amount of losses per trade and daily limit of losses.
- Profit taking: setting take profits at certain price levels.
Position size limit
One of the main mistakes of novice traders is that their positions are too large, which can lead to significant losses.
- The recommended risk per trade is 1-2% of the deposit.
- The recommended risk per day is no more than 5% of the deposit.
Use leverage with caution, as it significantly increases risks.
Setting stop losses and take profits
Stop loss limits losses by automatically closing the position when the specified level is reached.
Take profit captures the profit by closing the trade at a pre-set level.
That is, when opening a position, you can make sure that the position will not lead you to liquidation, and also automatically fix the profit by setting such orders in advance.
Constant monitoring of news and market situation
The cryptocurrency market is sensitive to news and there is often a high level of volatility, a sharp rise / fall in prices is associated with the news background.
For example:
- Regulatory changes (laws, bans, ETFs approved).
- Tweets from major investors, such as Elon Musk.
- Hacker attacks and hacking of exchanges.
- Launches or updates of cryptocurrency projects.
How do I follow the news?
- CoinMarketCap, CoinGecko — market tracking.
- CryptoPanic — news aggregator.
- Twitter (X), Telegram, and Discord are the main sources of information in the crypto community.
It is very important for novice traders to maintain discipline, manage risks, and follow the news. A clear trading plan, limiting the size of positions, and setting stop losses are necessary to minimize losses and increase the chances of reaching profitability.
Tools for dealing with volatility
Traders often use certain platforms, automation tools, and analysis services to effectively trade in a volatile market. Let’s look at the key tools that will help you manage risks and find profitable trading opportunities.
Platforms and exchanges with low fees
The choice of an exchange plays an important role, especially for short-term traders who want to minimize their commission costs.
Popular exchanges with low fees:
- Binance is one of the largest exchanges, with commissions of 0.1% and discounts when paying BNB.
- Bybit is popular among futures traders and has competitive commissions.
- OKX offers traders a wide range of functionality, including algorithmic trading.
- KuCoin – low commissions, support for many altcoins.
Also, some traders use referral links and VIP levels on exchanges to reduce the commission.
Bots for automated trading
Trading bots help you use volatility to your advantage by opening and closing trades without the trader’s involvement.
Properly configured trading bots offer a number of advantages:
- Automating actions. Bots can act much faster, i.e., enter and exit at a better price.
- Set up stop losses and take profits automatically
- Choosing cloud bots with different algorithmic strategies
Important: before using bots, test strategies on demo accounts and set limits on losses!
Real-time market analysis Apps
Monitoring market changes in real-time is an important part of successful trading. There are various analytical applications for both viewing charts and tracking large transactions on the exchange.
Examples of analysis tools:
- TradingView is a powerful tool for charting multiple assets.
- CoinMarketCap / CoinGecko – data on market capitalization and volumes.
- CryptoQuant / Glassnode -analysis of on-chain data. That is the activity of wallets and the movements of major players.
- Whale Alert -tracking large transactions on the blockchain.
Conclusion
Using the volatility of the cryptocurrency market in short-term trading requires a competent approach, discipline, and effective tools. Analyzing volumes and candle patterns using indicators, technical analysis, and automated strategies allows traders to make more informed decisions and find optimal entry and exit points.
However, high volatility carries not only opportunities, but also serious risks. Therefore, it is important to follow the risk management strategy, limit the size of positions, set stop losses and monitor the news background.