How to Measure Real Trading Performance Without Emotional Bias

Contents
- Introduction
- What Real Trading Performance Means
- Metrics for Measuring Trading Performance
- Risk/Reward Ratio and Stability
- Tools and Practices for Objective Analysis
- Conclusion
Introduction
Measuring trading performance plays just as important a role as choosing an entry point. In volatile cryptocurrency markets, emotions often distort perception: a series of successful trades can create the illusion of steady success. In contrast, several losing trades can give the impression of complete failure. A systematic evaluation of performance helps reduce this distortion, allowing one to see the actual dynamics of capital. The primary goal is to base decisions on data and avoid emotional pressure.
What Real Trading Performance Means

Actual performance is measured not by feelings, but by specific metrics. In trading — both in cryptocurrency markets and in traditional markets — the key benchmarks are verifiable indicators:
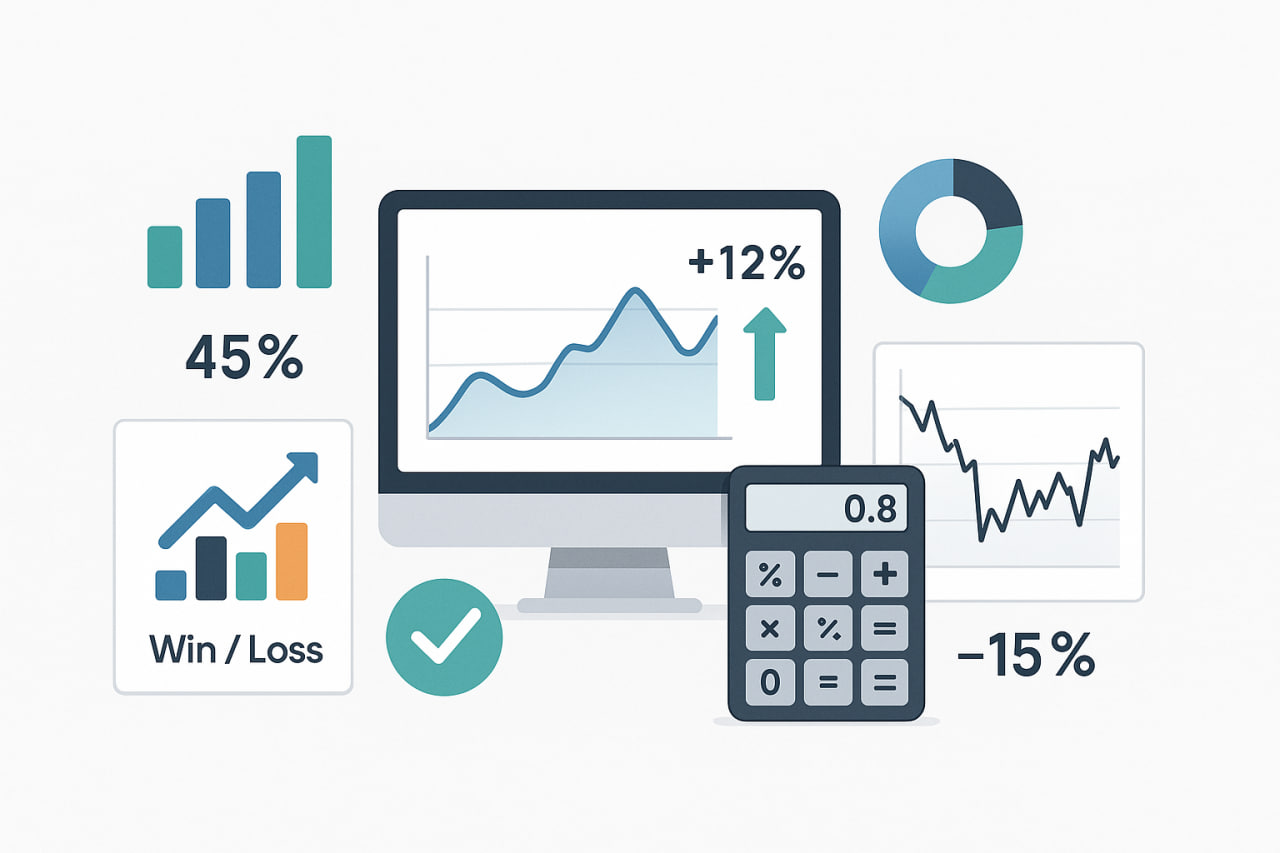
Metric | What It Shows | Example of Interpretation |
Net result for the period | Profit minus all costs | +12% for the quarter after deducting commissions |
% of profitable trades and average win/loss | Ratio of successful trades and their average result | 45% profitable, average gain twice as significant as average loss |
R-multiple (Expectancy in R) | Average result in units of risk per trade | 0.8R → strategy works but with limited efficiency |
Maximum drawdown and recovery | Depth of capital decline and speed of return to maximum | Drawdown −15%, recovery within 2 months |
Risk-adjusted return | The “quality” of profit, considering volatility and drawdowns | Sharpe 1.2, Sortino 1.8 |
Execution discipline | Share of trades executed strictly according to plan | 82% of trades executed by the rules |
These indicators record facts, help compare different periods and strategies, and reduce dependence on subjective assessments.
Emotions and Discipline in Evaluating Results
Fear often intensifies the focus on losses, while greed prompts unreasonable risk-taking after a series of wins. To reduce the influence of emotions, experienced traders systematise trades in a journal: recording the date, instrument, position size, entry and exit points, as well as their own state during the trade. This approach enables the identification of connections between results and psychological factors.
Regular journaling and analysis of key metrics according to a unified framework help to:
-
Track patterns in results
-
Distinguish the influence of the system from random factors
-
Reduce the risk of emotional decisions
-
Build consistency and strengthen discipline
Objectivity is achieved primarily through quantitative indicators, rather than subjective impressions.
Metrics for Measuring Trading Performance

For an accurate evaluation of results, a comprehensive set of indicators is used. They make it possible to consider not only profit, but also the quality of the process. This approach simplifies the comparison of different strategies and helps to understand the system’s resilience.
Profit and Loss Not as the Only Criterion
Although final income is essential, it does not reflect the whole picture. Two strategies may produce the same financial outcome but differ significantly in their level of risk. Therefore, when analysing, attention is paid to the depth of drawdowns, the ratio of profitable to losing trades, the average size of gains and losses, as well as execution discipline. This allows one to assess real results without being limited to subjective impressions.
Risk/Reward Ratio and Stability
One of the key benchmarks remains the risk-reward ratio, which shows how much potential profit justifies the risk of a trade. If a strategy provides a ratio of 1:2 or higher, then even with a moderate share of successful trades, the result can still be positive.
Stability is no less critical:
-
Capital volatility shows how evenly the account changes over time
-
Execution consistency reflects the share of trades conducted according to the rules
-
Analysis of profitable streaks and duration of drawdowns makes it possible to judge the reliability of a strategy
It is precisely the combination of an adequate risk/reward ratio and stability that makes a trader’s performance as objective and practical as possible for long-term work.
Risk-Adjusted Indicators
For the assessment to be complete, traders use metrics that connect profit with the level of risk.
-
Sharpe Ratio. Shows how much profit a strategy generates per unit of total risk. Risk here means all account fluctuations — both growth and decline.
-
Sortino Ratio. Works similarly, but considers only losses and drawdowns. Capital growth is not perceived as risk, so this indicator provides a “softer” picture.
-
Maximum drawdown and recovery time. These parameters indicate the depth of capital decline and the rate at which the account returned to its previous level.
-
Risk-adjusted return. The final indicator that helps compare strategies over the long run. It shows not only profit, but also its “quality” — how stable and safe the result is.
Such indicators help measure trading efficiency without emotions and provide an objective foundation for comparing different approaches.
Tools and Practices for Objective Analysis

The assessment of trading performance becomes accurate only when the right tools are available. It is essential to record every trade and utilise an analysis system that is independent of emotions. For this purpose, trading journals, spreadsheets, and specialised software are employed. Such solutions enable the measurement of actual results, tracking of key metrics, and the development of a long-term strategy based on them.
Journal, Discipline, and Emotions in Analysis
Emotions significantly impact the trading process: fear intensifies focus on losses, while greed prompts excessive risk-taking. To mitigate this effect, traders record their trades while also noting their own emotional state. Such a journal can be as simple as a notebook, an electronic spreadsheet, or part of specialised software. Regularity of entries and structured data play a key role.
A journal typically includes:
-
Date and time of the trade
-
Instrument and position size
-
Entry and exit price
-
Level of risk and potential profit
-
Trade result
-
Comment with reasons for entry and notes on the trader’s condition
This approach helps identify patterns, track execution discipline, analyse the impact of emotions, and adjust the strategy accordingly. Systematic journaling creates the habit of making decisions based on facts rather than subjective impressions.
Use of Specialised Software and Spreadsheets
Modern traders increasingly use digital tools that automate the calculation of indicators and eliminate errors. Programs and spreadsheet templates enable the analysis of the percentage of profitable trades, average win and loss sizes, maximum drawdown, and Sharpe and Sortino ratios.
Key advantages of such tools include:
-
Automatic calculation of indicators without errors
-
Charts and diagrams for visual analysis
-
The ability to compare different periods and strategies
-
Minimisation of emotional influence when summarising results
For everyday work, detailed trader statistics are invaluable: they provide transparent, real-time data, include summaries of trades and drawdowns, risk-reward indicators, and convenient analysis tools. This format helps beginners quickly identify the strengths and weaknesses of their trading, while experienced traders can systematically improve their strategy and monitor progress based on facts rather than feelings.
The Role of Self-Control and Consistency
Discipline makes trading predictable. If a strategy is followed according to established rules, the influence of emotions decreases. Self-control helps to avoid unnecessary trades and excessive increases in position sizes.
Useful principles include:
-
Record every trade and analyse it afterwards
-
Summarise results weekly and monthly in a unified format
-
Check compliance with risk and profit limits
-
Evaluate results not only by income but also by the quality of strategy execution
Conclusion
Objectivity in trading is best achieved through facts and quantitative indicators. Real results emerge when performance metrics, systematic trade analysis, and adherence to risk management rules are utilised. Emotions will always be part of the market; however, discipline and methodical practices allow traders to maintain stability and develop over the long term.