Overview of Technical Analysis Tools on the Crypto Market: From TradingView to AI Platforms
Contents
- Introduction
- Basic principles of technical analysis
- Popular tools for technical analysis
- AI and machine learning platforms
- Comparison table of tools
- Advantages and disadvantages of tools
- Tips for choosing a tool
- Conclusion
Introduction
Technical analysis is one of the most effective methods for analyzing price movements in the cryptocurrency market, which helps traders make informed decisions. TA helps you identify key support and resistance levels, identify trends, and signal possible reversals. This is especially important in short-term trading, where every mistake can lead to significant losses.
Technical analysis is based on the study of historical data on prices and trading volumes, which allows you to understand the behavior of the market. It involves the use of various tools, such as indicators, graphical patterns and volumes, which in combination help traders make decisions about opening and closing trades.
The purpose of this article is to give readers an idea of the key technical analysis tools that are particularly useful for working in the cryptocurrency market. We will look at both traditional platforms such as TradingView, Coinigy, and MetaTrader 4/5, as well as more modern solutions based on artificial intelligence( AI): CryptoHopper, Santiment, and TensorCharts.
Basic principles of technical analysis
Technical analysis is a method of analyzing price movements based on historical data such as price, volume, and market trends.
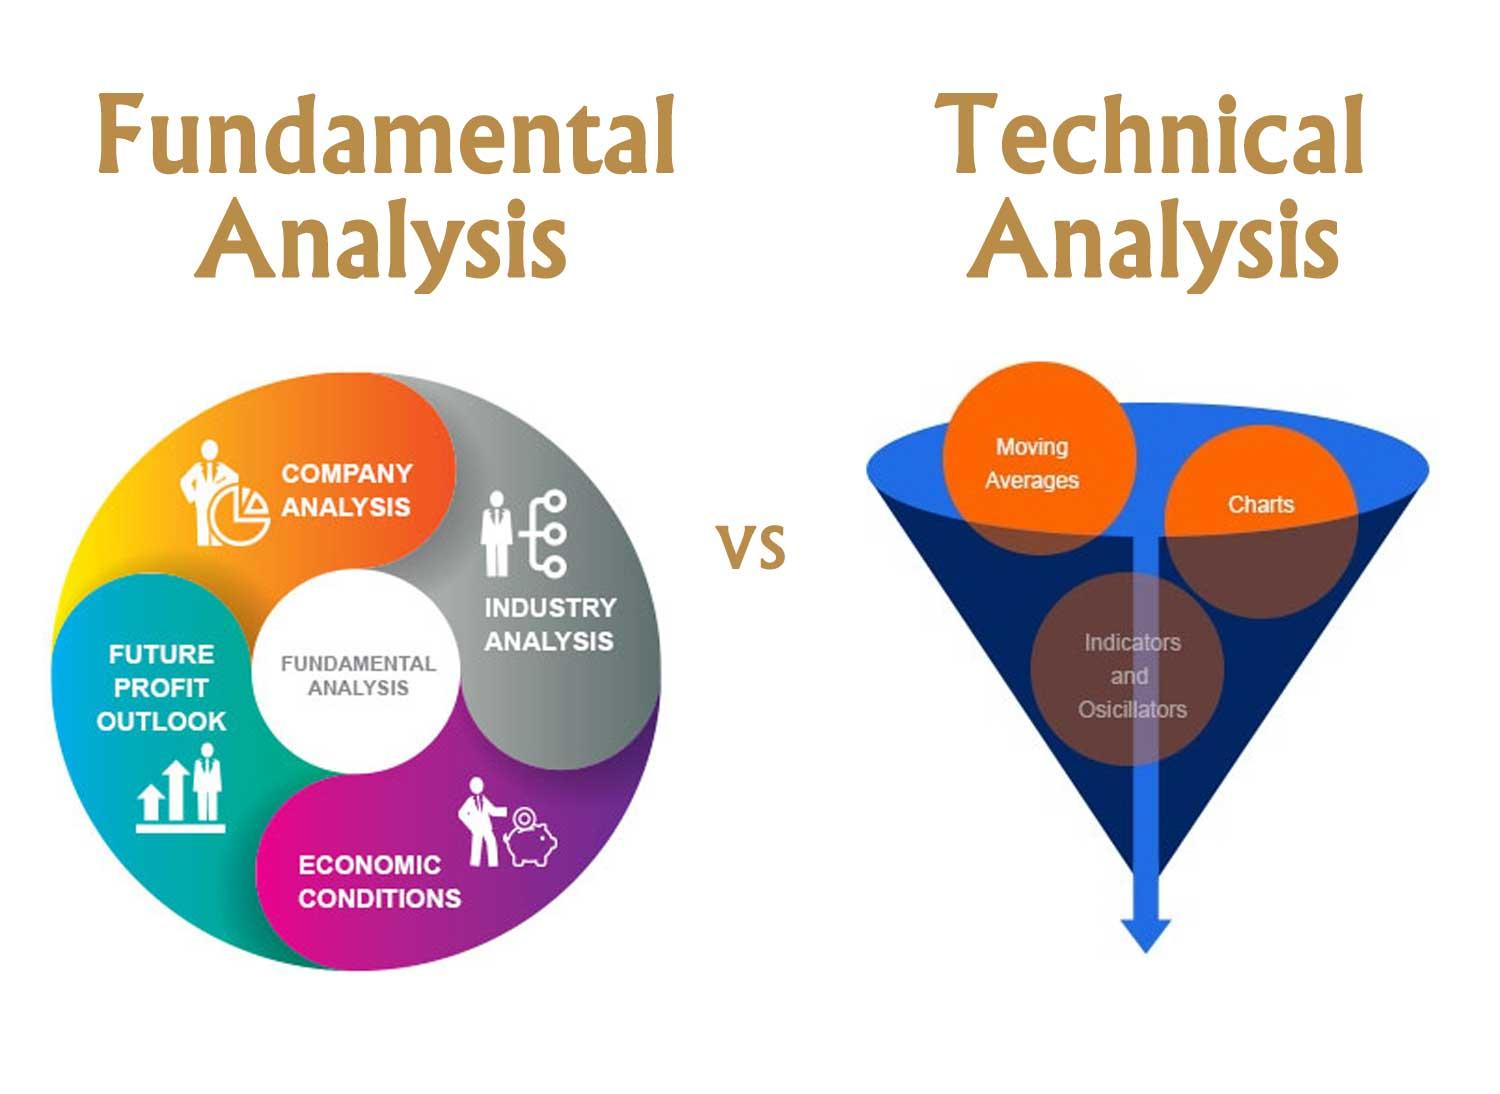
Unlike fundamental analysis, which evaluates the intrinsic value of an asset, such as a development team, technology, or market demand, technical analysis is based on graphical data and statistical indicators.
Let’s take a closer look at the differences between these types of analysis using the table:
| Criterion | Technical Analysis (TA) | Fundamental Analysis (FA) |
| The approach | Analyzes historical data (charts, indicators, volumes). | Studies fundamental factors (news, projects, economics). |
| The goal | is to analyze short-term price movements. | Assessment of the long-term perspective of an asset. |
| The main tools | are Indicators, charts, and candle patterns. | Reports, news, and market events. |
| Type of traders | Short-term traders, scalpers. | Long-term investors. |
Technical analysis is especially useful in the crypto market, as cryptocurrency prices often move under the influence of speculation, trends and trader behavior, and not just fundamental factors.
The role of charts, indicators, and patterns
Charts, indicators, and patterns are key elements of technical analysis. These tools help traders analyze historical data, identify trends, and evaluate price movements in the crypto market.
Charts are the main tool of technical analysis because they clearly show the price movement over a certain period of time.
The most popular type of chart is the candlestick chart. Displays the opening price, closing price, highs and lows for a specific period.
Why are charts important?
- They help you identify key support and resistance levels.
- They allow you to see the market structure: trends, sideways movements, breakouts
- Primary analysis of price movements
Indicators are tools based on mathematical calculations that help traders analyze market conditions. They can confirm trends, determine overbought/oversold conditions, and measure volatility.
Patterns are repetitive patterns on charts that help traders determine price movement. They are divided into:
- reversals that signal a change in trend
- continuations confirming that the current trend is maintained
Charts visualize market data, indicators help quantify trends and volatility, and patterns help traders understand price movements.
Popular tools for technical analysis
Technical analysis of cryptocurrencies requires the use of specialized platforms and tools that help traders analyze charts, apply indicators, track market data, and automate trading strategies.
Next, we will analyze the most popular tools used by traders.
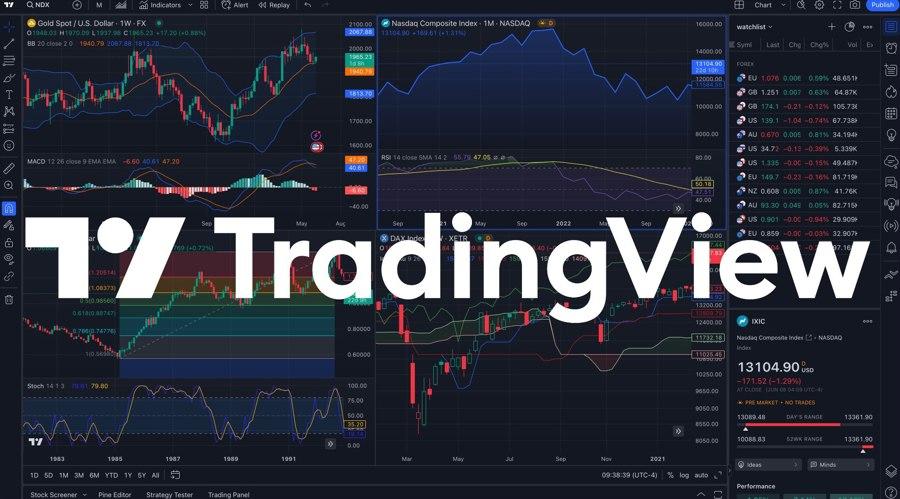
TradingView
TradingView is one of the most popular platforms for technical analysis, providing convenient charting tools, indicators, and opportunities for collaborative analysis.
Main functions:
- A huge selection of indicators and oscillators. Such as RSI, MACD, Bollinger Bands, etc. (up to three indicators on a single chart in the free version)
- Ability to create custom indicators using Pine Script.
- Interactive graphics and user-friendly interface.
- A social network for traders – you can share your ideas and analysis.
- Access to basic time intervals (1 min, 5 min, 1 hour, 1 day, etc.).
The perfect tool for beginners and experienced traders who want to analyze the cryptocurrency market using a variety of different indicators and tools on the coin chart.
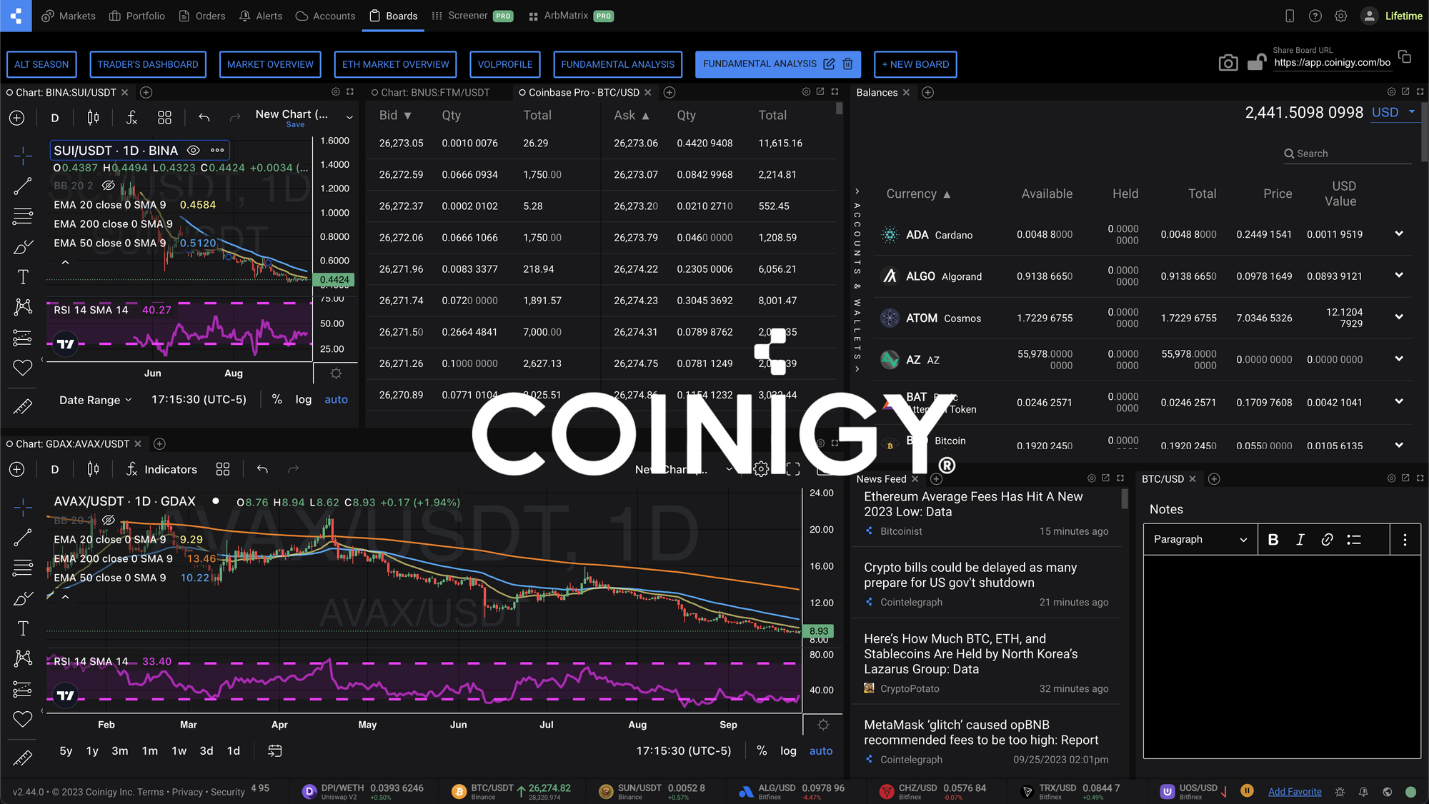
Coinigy
Coinigy is an advanced platform for trading and managing crypto assets that allows users to analyze charts, make trades, and track portfolios on various exchanges from a single interface.
Integration with crypto exchanges
One of the main advantages of Coinigy is its support for more than 45 cryptocurrency exchanges, including Binance, Coinbase Pro, Kraken, Bitfinex and others.
How does the integration work?
- The user connects API keys to their exchange accounts.
- Coinigy gets access to your account data (balances, orders, and transaction history).
- A trader can trade on multiple exchanges simultaneously without having to open each one manually.
Thus, integration with exchanges makes Coinigy a convenient tool for traders working with several trading platforms at the same time.
Ease of working with the portfolio
Coinigy provides users with powerful tools for monitoring cryptocurrency assets and managing their investment portfolios.
Key functions of working with the portfolio:
- Automatic balance update: Coinigy syncs data with connected exchanges and displays the user’s total balance, including all cryptocurrencies and trading positions.
- Visualization of asset allocation: The platform has user-friendly charts that allow you to analyze the portfolio structure, the share of each coin, and changes in the value of assets.
- Trade history and Profit/loss analysis: The user can track all their trades, calculate total returns, and analyze the effectiveness of their trading strategy.
- Setting up Notifications: Coinigy lets you set up alerts for significant price changes, volatility, or when certain price levels are reached.
These features are especially useful for investors who hold long-term positions and want to manage their portfolio efficiently without having to manually track each exchange.
Working with technical indicators
Coinigy offers a wide range of indicators that allow traders to analyze price behavior, identify trends, and find market entry points.
Examples of common and available indicators in Coinigy:
- Moving Averages (SMA, EMA):
They are used to determine the direction of the trend and search for entry and exit points from trades.
- Bollinger Bands:
They help you assess market volatility and possible price reversal points.
- RSI, MACD, Stochastic:
They allow you to detect whether an asset is overbought or oversold, as well as find buy or sell signals.
- Fibonacci levels and horizontal support and resistance levels:
They are used to determine potential trend reversals and target price levels.
- Volumes and candle patterns:
Volume analysis helps to confirm the strength of the trend, and candle patterns signal possible changes in the market dynamics.
In general, Coinigy is especially useful for active traders who work with multiple exchanges and want to quickly analyze data without having to constantly switch between different platforms. It will also be convenient for long-term investors who want to track the dynamics of their portfolios in one place.
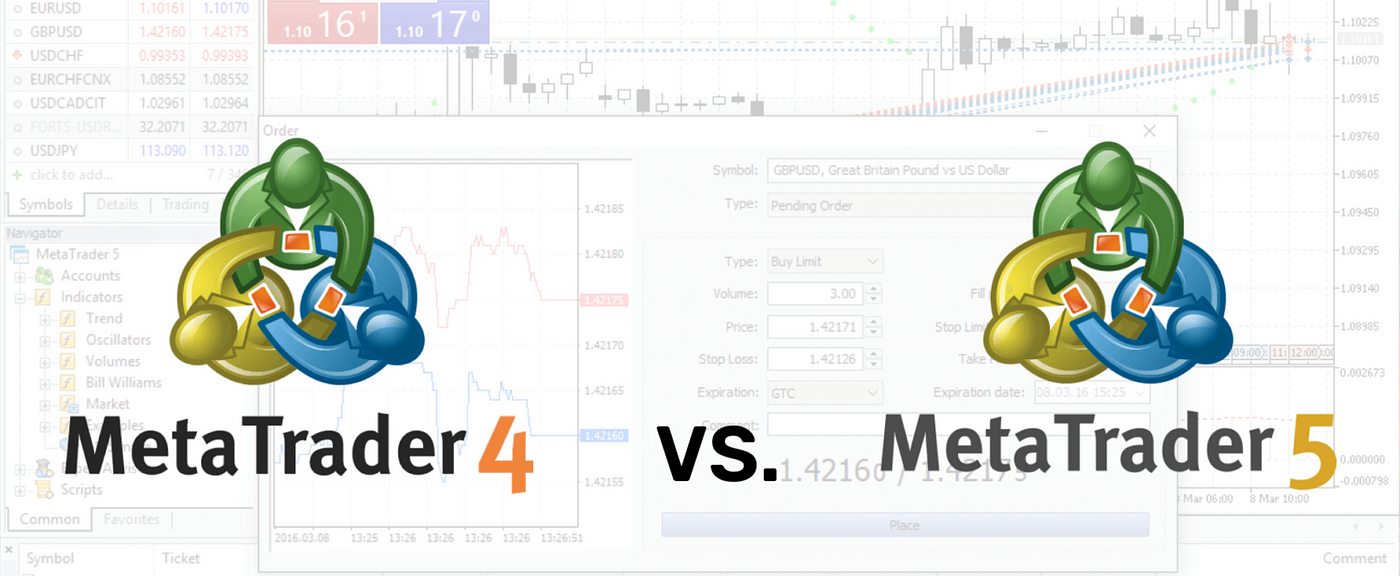
MetaTrader 4/5 (MT4/MT5)
MetaTrader 4 (MT4) and MetaTrader 5 (MT5) are two of the most popular platforms for technical analysis and trading, originally developed for the Forex market. However, thanks to the support of contracts for difference (CFDs) and API integration, they are also actively used in cryptocurrency trading.
Features of MetaTrader 4/5 in the cryptocurrency market
First, let’s define the differences between the versions of the MetaTrader platform:
Function MT4 MT5
| Function | MT4 | MT5 |
| Number of timeframes | 9 | 21 |
| Market Depth (DOM) | No | Yes |
| Built in economic calendar | No | Yes |
| Number of order types | 4 | 6 |
| Multithreaded trading support | No | Yes |
| Order execution speed | is Lower | Higher |
MT5 is a more advanced version that is better suited for scalping and high-frequency trading. However, MT4 remains in demand among traders who use manual strategies.
Key features of the platforms:
- Advanced technical analysis tools
- More than 30 built-in indicators, including MACD, RSI, Moving Averages, and Bollinger Bands.
- Ability to add custom indicators and strategies.
- Flexible chart settings with timeframes from 1 minute to 1 month.
- Different types of orders
- Market, pending, and stop orders.
- Trailing stop for profit protection.
- Flexible risk management settings.
- Trading through CFD contracts
- Access to cryptocurrency pairs through brokers that support CFD trading.
- Possibility of trading with leverage.
- Short and long positions to work in any market condition.
- Compatible with multiple exchanges and brokers
- MT4/MT5 can be used with cryptocurrency brokers such as Binance Futures, Bybit, Kraken, and others through plugins and API bridges.
- The ability to connect to decentralized exchanges through special solutions.
- Flexibility in setting up the interface
- Ability to create multiple profiles and workspaces.
- Simultaneous tracking of multiple charts.
- Support for multiaccounts is important for arbitrage between exchanges.
Support for automated trading (trading robots)
One of the main advantages of MetaTrader is the ability to automate trading using robots.
Automated trading systems in MetaTrader are based on programming trading strategies using the built-in MQL4 (for MT4) and MQL5 (for MT5) languages. They allow you to create an algorithm that follows the specified rules:
- Determine entry and exit points based on indicators and patterns.
- Open and close orders automatically.
- Manage risks by stop losses and take profits.
- Use scalping, arbitrage, or martingale strategies.
- Monitor the market 24/7 without the participation of a trader.
Disadvantages and risks
- The market is changing – the strategy may become outdated and stop working.
- Technical failures – errors in the code can lead to losses.
- Need for monitoring – robots require regular optimization.
- Server dependency – failure to connect to the exchange can lead to loss of control.
Automated trading in MT4 and MT5 is a powerful tool for cryptocurrency traders. It allows you to eliminate human errors and emotional decisions, as well as increase the speed of order execution.
If a trader is just beginning to master automated trading, it is best to start by testing ready-made bots, and then move on to developing your own solutions.
AI and machine learning platforms
Modern technologies of artificial intelligence (AI) and machine learning (ML) are being actively implemented in the analysis of cryptocurrency markets. These platforms help traders analyze price movements, automate trading, and find profitable trades based on historical data and market signals.
Next, we will analyze popular examples of platforms using AI and machine learning.
CryptoHopper: A platform for automated cryptocurrency trading
CryptoHopper is a cloud-based automated crypto trading platform that allows users to set up trading bots, analyze the market, and manage a portfolio on multiple exchanges simultaneously.
Key Features of CryptoHopper
CryptoHopper offers flexible automated trading tools that are suitable for both beginners and experienced traders.
- Connect to the main crypto exchanges - Binance, Coinbase Pro, Kraken, KuCoin, Bybit, and others.
- Automated trading bots – execution of strategies without the participation of a trader.
- Strategy marketplace – buying and selling ready-made algorithms from other users.
- AI and machine learning – Market data analysis to find profitable deals.
- Grid and DCA bots are averaging strategies for minimizing risks.
- Signal system - subscription to trading signals from experts.
- Cloud operation – does not require installation on a computer and is available from any device.

Automation of analysis and trading.
Big Data Analysis: AI helps process and analyze huge amounts of data (Big Data) in a short period of time, which allows traders to keep up to date with the most relevant market events and quickly adapt their strategies.
Sentiment Analysis: AI also takes into account news, forums, social networks, and other external data to assess overall market sentiment. This allows you to detect potential unexpected market reactions and news that may affect prices.
Automated trading using AI
After the AI analyzes the market and determines the current movement, it can automatically manage trading orders and adjust strategies based on market conditions. In CryptoHopper, this is done with the help of trading bots that perform tasks similar to the actions of a trader, but without his participation.
These bots use AI forecast to execute orders to buy or sell assets. AI makes decisions based on the current market situation, indicators, and sentiment, which allows you to create trading systems without human intervention.
Santiment: Market Sentiment Data Analysis and deep network data analytics
Santiment is a powerful tool for analyzing data about the cryptocurrency market, which actively uses Sentiment Analysis and deep network data analytics. The platform provides traders, investors, and analysts with tools to gain insights about the cryptocurrency market by analyzing public sentiment, user behavior, and other key indicators.

Analysis of market sentiment data (Sentiment Analysis)
One of the main areas of work of Santiment is sentiment analysis, which helps to determine the psychological state of market participants. This allows traders to understand how the mass audience reacts to various events, news and trends, which in turn helps predict possible price movements.
Sentiment analysis in social networks: Santiment collects and analyzes data from popular social platforms such as Twitter, Reddit, and Telegram, which allows you to track the emotions and moods of market participants in real time. For example, positive or negative statements about a particular cryptocurrency can affect its price.
Sentiment Indicators: The platform uses its own sentiment indicators, such as the Sentiment Score, which helps you assess how positively or negatively an asset is perceived. This can be useful for short-term traders who need to respond to changes in market sentiment.
Keyword Analysis: Santiment analyzes keywords and phrases related to cryptocurrencies and uses them to evaluate the overall market reaction. This allows you to identify trends and focuses of attention of the cryptocurrency community, as well as predict possible price movements.
Deep Network Data Analytics
In addition to sentiment analysis, Santiment provides tools for deep analysis of network data, which allows traders to study the behavior of the blockchain network itself and transactions.
- Analysis of blockchain activity:
Santiment tracks and analyzes data on transactions, the number of active addresses, trading volumes, and other key metrics that provide insight into the current state of cryptocurrency on the network. This data can be useful for assessing liquidity and trends.
- Volumes and capitalization:
The platform provides analytics on trading volumes, capitalization, and average transaction volumes, which helps traders assess how active the market is and what can affect the price of cryptocurrencies.
- Data about tokens:
Santiment allows you to analyze the behavior of tokens on the blockchain, including the activity of holders, the movement of tokens between addresses, and other key metrics. This helps traders identify market manipulation or strong buying and selling patterns that may portend major moves.
- On-chain data:
Using on-chain analytics, Santiment enables traders to track the actions of major players in the market and assess which cryptocurrencies may be susceptible to manipulation.
TensorCharts: Graphs with large data and tools for deep analysis
TensorCharts is a platform for analyzing volume data and liquidity in the cryptocurrency market, offering traders tools for analyzing transaction volumes, liquidity, and other important metrics.
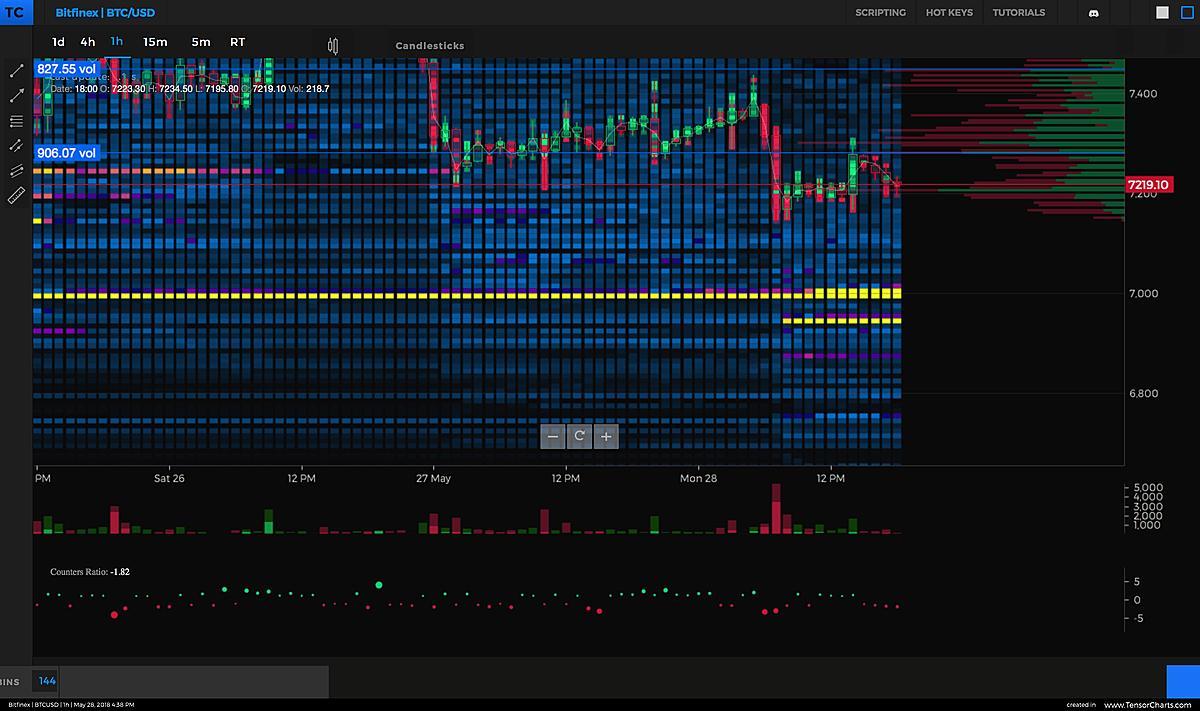
Graphs with volume data
One of the main tools of TensorCharts is charts with volume data, which allow traders to analyze the most important indicators, such as transaction volume, liquidity, price levels and market depth.
- Transaction volumes:
The platform displays trade volumes in real time, which helps traders see key price levels with high volumes.
- Market Depth:
Shows order volumes at various price levels, which allows you to assess the liquidity in the market.
- Volume by price level:
Displays information about the price levels at which large trades were made, which helps to identify support and resistance levels.
Tools for deep analysis
TensorCharts offers several tools for deep market analysis that allow traders to better understand price movements and the behavior of large market participants:
- Liquidity at different levels:
The platform allows you to analyze liquidity at various price levels and assess the probability of a level breakdown.
- Network charts:
Analyzes the behavior of large market participants (whales), allowing you to track their actions.
- Trend indicators:
The platform includes indicators for predicting trends and evaluating market behavior.
These tools help traders conduct in-depth market analysis, accurately identify key levels, and better see price changes based on liquidity behavior and trade volumes.
Comparison table of tools
Next, we will compare technical analysis tools using a table that includes price, functionality, supported exchanges, and additional features.
| Tool | Price | Functionality | Supported exchanges | Additional features |
| TradingView | Free version, paid from $14 / month | Charts, indicators, technical analysis, social functions, Pine Script | scripts Support for most major exchanges | Social interaction, creation of trading strategies |
| Coinigy | From $18.66/month | Charts, indicators, access to a variety of exchanges, integration with exchanges | More than 45 trading | support, portfolio analysis, notifications |
| MetaTrader 4/5 | Free, payment for robots | Charts, indicators, automated trading, support for scripts and robots | Main crypto exchanges via API | Support for automatic trading with CryptoHopper robots |
| CryptoHopper | From $19 / month | Automatic trading, indicators, strategies, trading via bots | More than 75 exchanges | Support for trading bots, signal settings |
| Santiment | Paid subscription, price on request | Market sentiment analysis, social media data, historical data | All major crypto | exchanges Deep Network data Analysis, sentiment analysis |
| TensorCharts | Free / Paid features | Charts with transaction volumes, liquidity, deep market analysis, volume Data | All major exchanges | Tools for analyzing liquidity and volume data |
Advantages and disadvantages of tools
For successful trading on the crypto market, it is important to choose the right tools for technical analysis that will help you effectively work with volatility and make informed trading decisions. Each tool has its own advantages and disadvantages, and the choice depends on your goals and level of experience.
TradingView is a great choice for beginners and professionals alike, thanks to its user-friendly interface and many charts and indicators. The platform also supports social features, allowing traders to exchange ideas. However, you will need a paid subscription to use the features fully.
Coinigy offers integration with more than 45 cryptocurrency exchanges and provides tools for portfolio monitoring and market analysis. Despite its functionality, the high cost of a subscription may be a limitation for some users.
For more experienced traders interested in automated trading, a good choice would be MetaTrader 4/5 or CryptoHopper, which supports trading robots and strategies. However, mastering these platforms requires certain skills and experience.
Santiment and TensorCharts offer an in-depth analysis of market sentiment and liquidity data, which is ideal for more professional traders who want to work with volume data and analyze market movements. These platforms may be challenging for beginners, but they offer unique opportunities for analyzing the crypto market.
To sum up, each of these platforms solves its own problems, and the choice of a tool depends on what aspects of trading are important to you and what level of experience you have.
Tips for choosing a tool
The choice of a technical analysis platform depends on many factors, including the trader’s goals, level of experience, and preferences in trading types. Here are some recommendations to help you choose the right tool.
How to choose a platform based on your goals and experience.
1. Define your goals
If your goal is to analyze the market and create trading strategies, then platforms with extensive chart and indicator capabilities, such as TradingView, will suit you. This will allow you to gain a deeper understanding of market behavior and use various technical tools.
If you want to automate trading, choose platforms that support trading robots, such as CryptoHopper or MetaTrader. They will provide automation of processes, minimizing human intervention.
You can also invest in indices, where the entire trading process takes place without the participation of the investor himself with regulated risks. TradeLink - invest in risk-resistant crypto indexes made up of the best algorithmic traders ’ strategies on your personal account on the Binance exchange
Platforms such as Sentiment and TensorCharts are suitable for deep data analysis and trend analysis, which allow you to analyze market sentiment and liquidity, which is especially useful for more experienced traders.
2. Consider your experience
For novice traders, it is best to choose platforms with an intuitive interface and access to basic functions. TradingView is a great choice, as it offers a simple and user-friendly interface, as well as basic analytical tools.
Coinigy can also be useful due to its simplicity, but it is worth considering that this platform is paid.
For experienced traders who want to work with more complex strategies and automation, platforms such as MetaTrader 4/5 or CryptoHopper will be more suitable. These tools allow you to work in depth with trading robots and algorithms.
3. The importance of testing and learning
Before making a final decision, it is important to test several platforms and choose the one that best suits your needs. Most platforms offer free versions with limited functionality, which allows you to get acquainted with their capabilities without risk.
Don’t forget that training and practice are key aspects of successful trading. Before you start active trading, you should complete training, learn strategies, use demo accounts, and test your trading approaches.
Ultimately, the choice of a tool depends on your preferences, level of experience and goals that you set for yourself in the crypto market. Thorough testing and training will help you make a more informed decision and increase the likelihood of successful trading.
Conclusion
In conclusion, the choice of a tool for technical analysis in the crypto market depends on your goals and level of experience. TradingView and Coinigy provide powerful market analysis and portfolio management features that are suitable for most traders. To automate trading, you should pay attention to MetaTrader and CryptoHopper. Artificial intelligence platforms such as Santiment and TensorCharts offer in-depth data analysis, which is useful for experienced traders. Each instrument has its own characteristics, and it is important to choose the one that suits your needs and trading style.
It is important not only to get acquainted with the functionality of each platform but also to test them in action in order to understand which tool is best suited for your style of work in the crypto market. No matter which tool you choose, training, testing, and practice will be key factors in successful cryptocurrency trading.