Portfolio charts
Easily analyze your profitability with TradeLink.
We have developed unique charts using a variety of formulas that can tell you everything about the performance of a strategy for any given period of time, taking into account unrealized profits. We are one of the only services that provide this functionality.
Here is our short video about portfolio charts
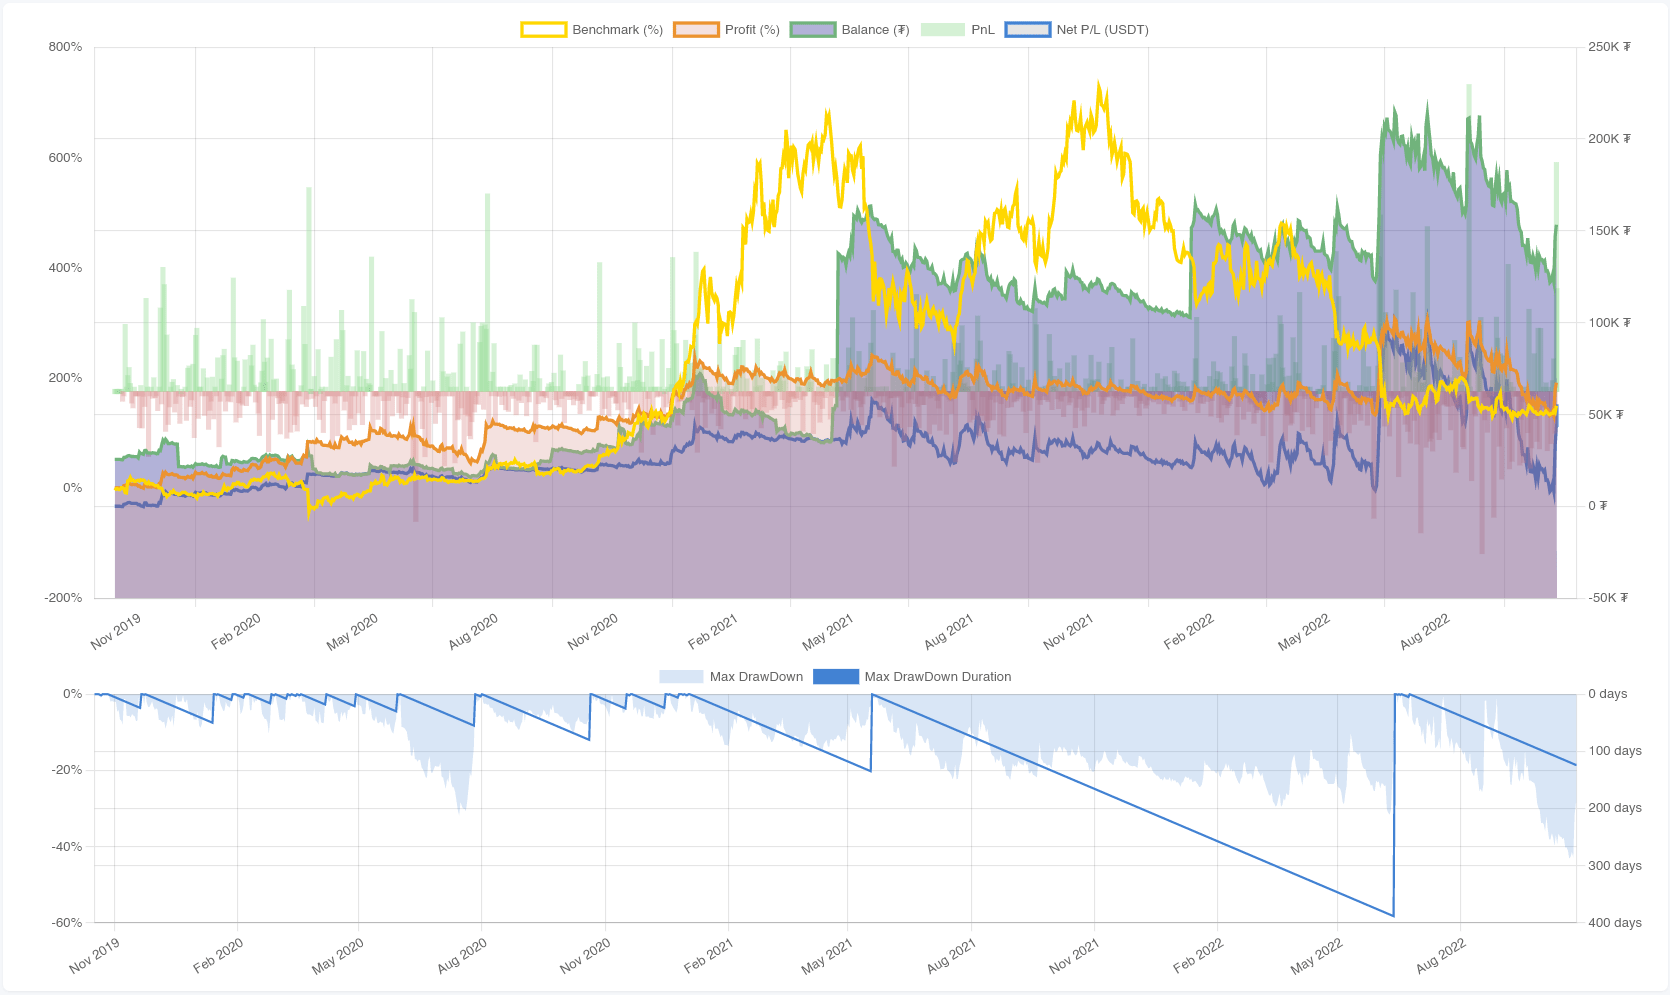
Let’s take a closer look at these graphs:
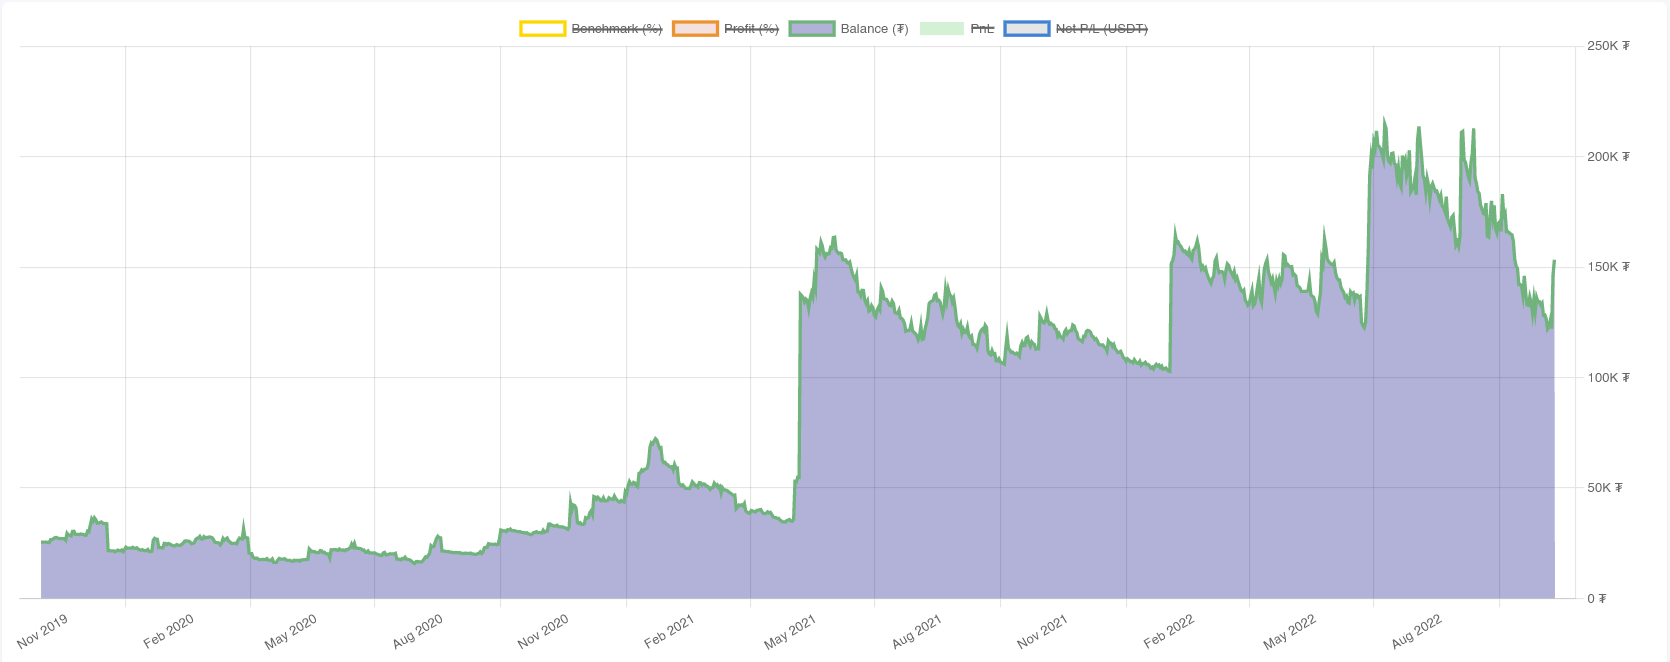
The Balance graph displays the absolute deposit amount in the base currency. This greatly helps in analyzing the behavior of the strategy and the psychology of the trader depending on the size of the deposit.
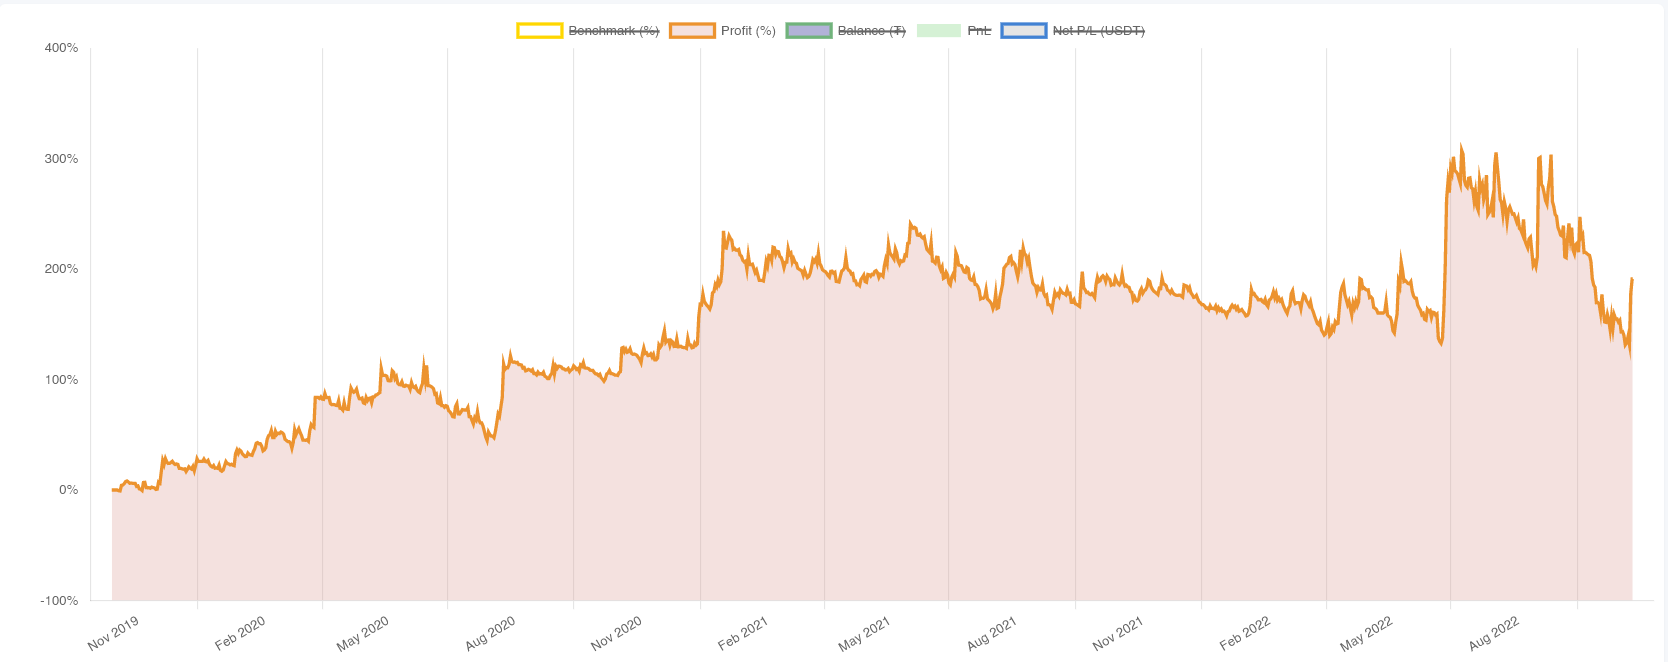
The Profit(%) chart displays cumulative income from the initial deposit as a percentage. Thanks to it, you can easily analyze the relative profitability of the strategy.
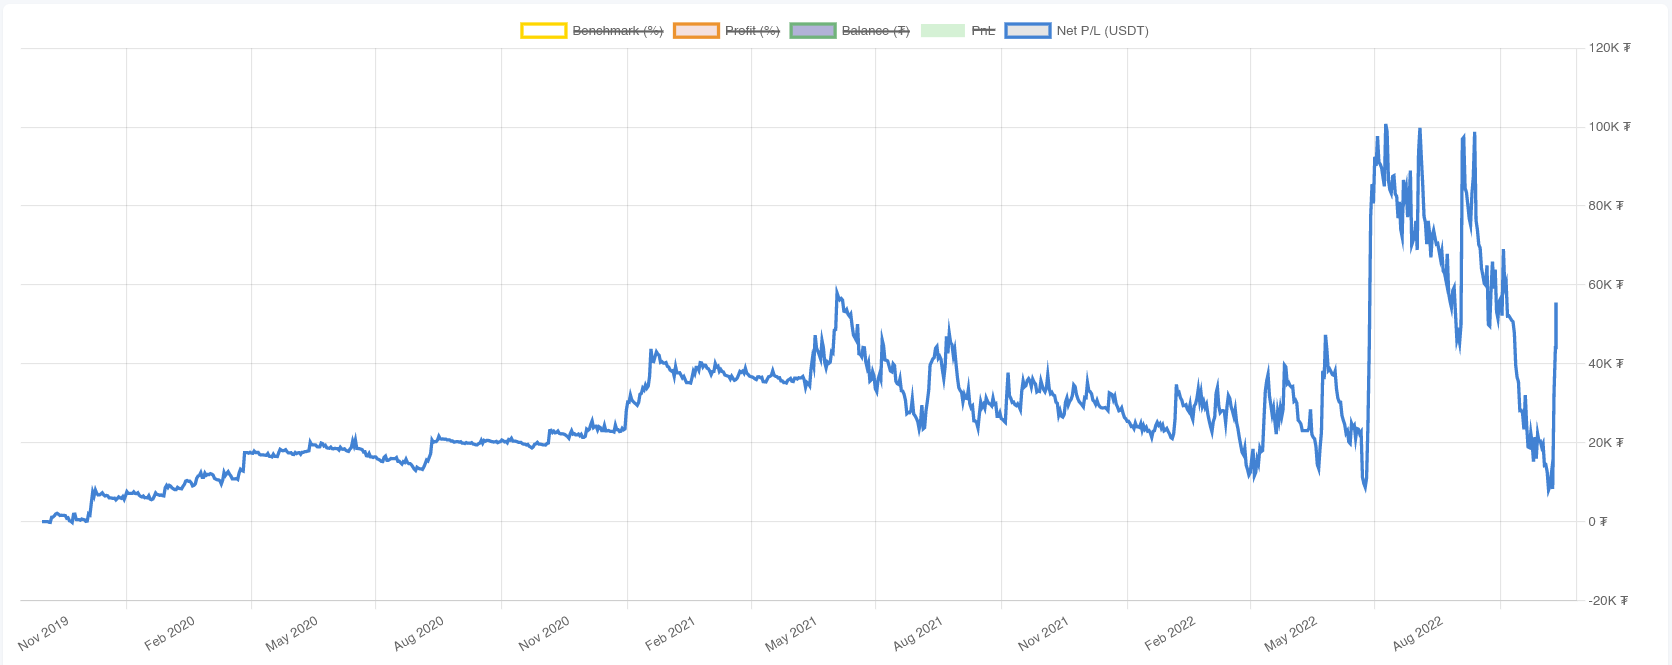
The Net P&L chart displays the absolute profit of the strategy. An absolutely indispensable tool to quickly calculate the absolute profit of a strategy for a period, or analyzing the actual state of affairs.
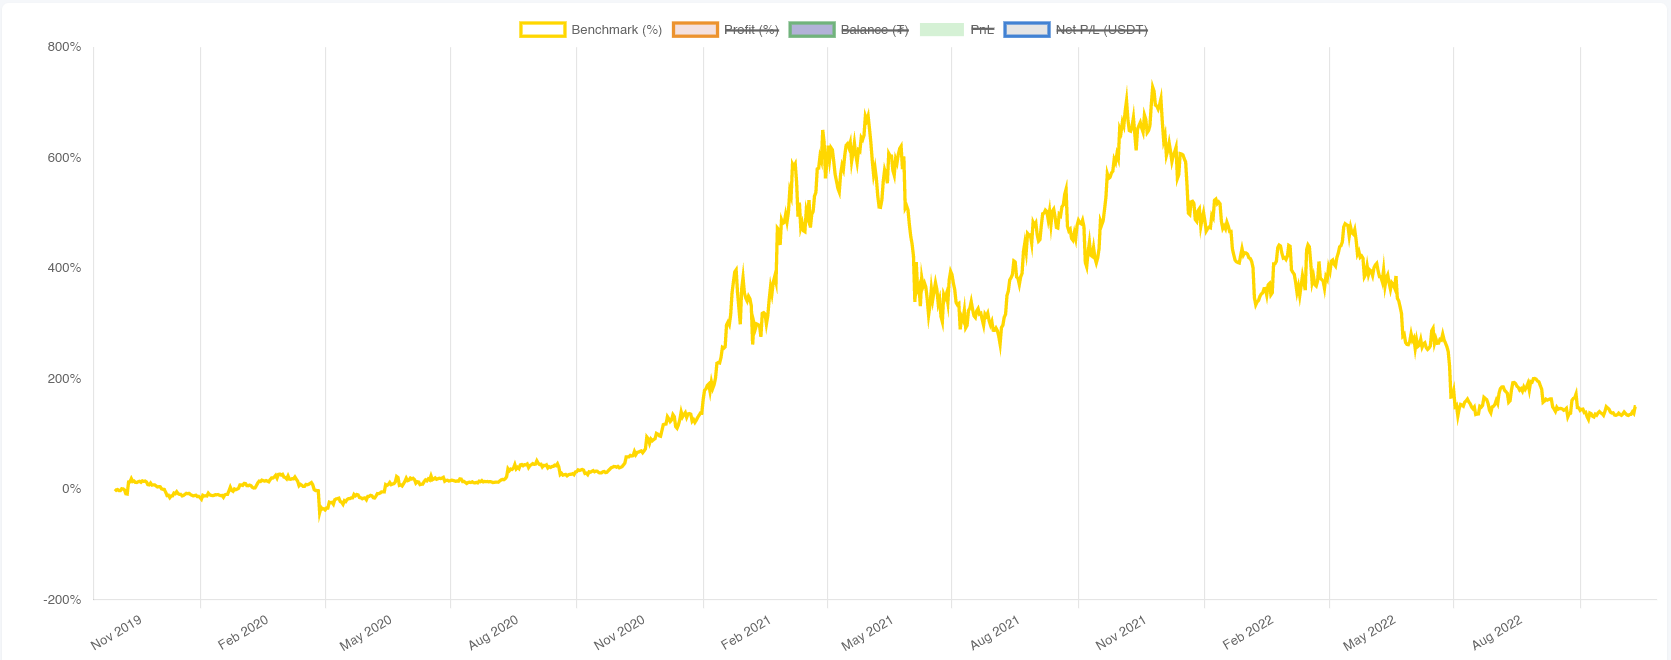
The Benchmark chart is a display of bitcoin profitability. We added it to instantly compare the performance of the strategy with respect to Bitcoin, which is a key metrics in crypto trading.
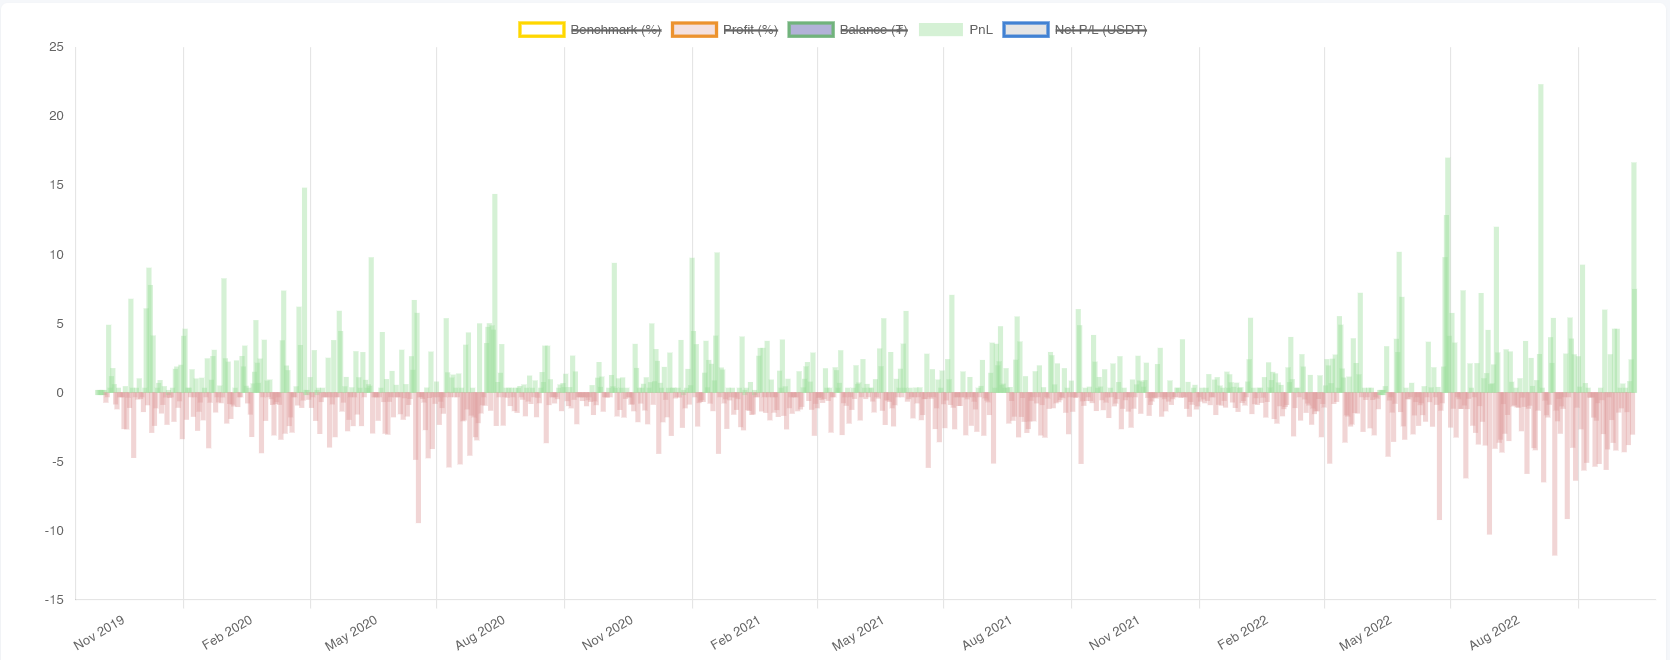
Profit and Loss histogram. For the convenience of displaying changes in profitability over a period, we also have a histogram with which you can quickly navigate relative and absolute changes over the last period.Alongside these main indicator graphs we also have 2 additional indicators showing the drawdown.
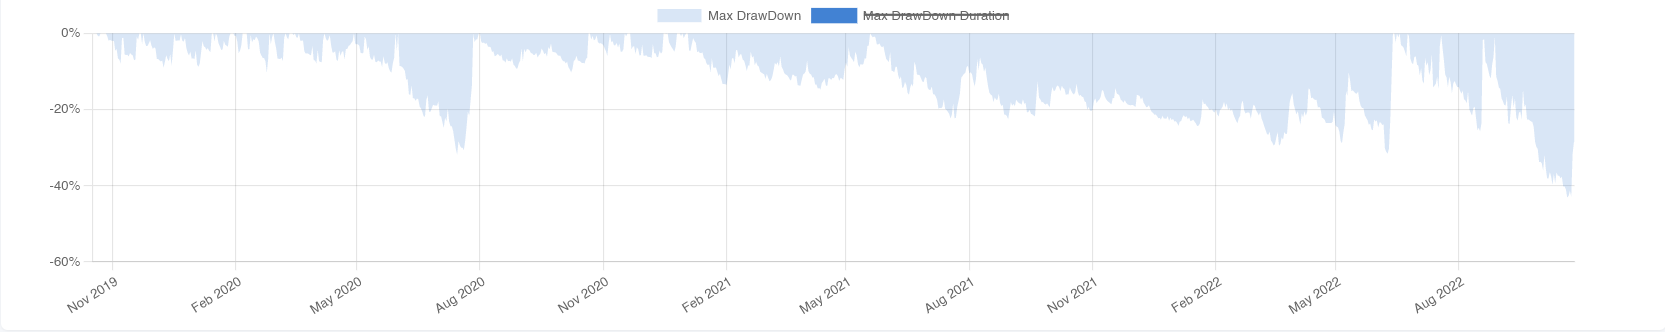
The first one is called Maximum DrawDown and it displays the relative loss of the strategy from the maximum deposit. This helps to quickly navigate the mistakes made.
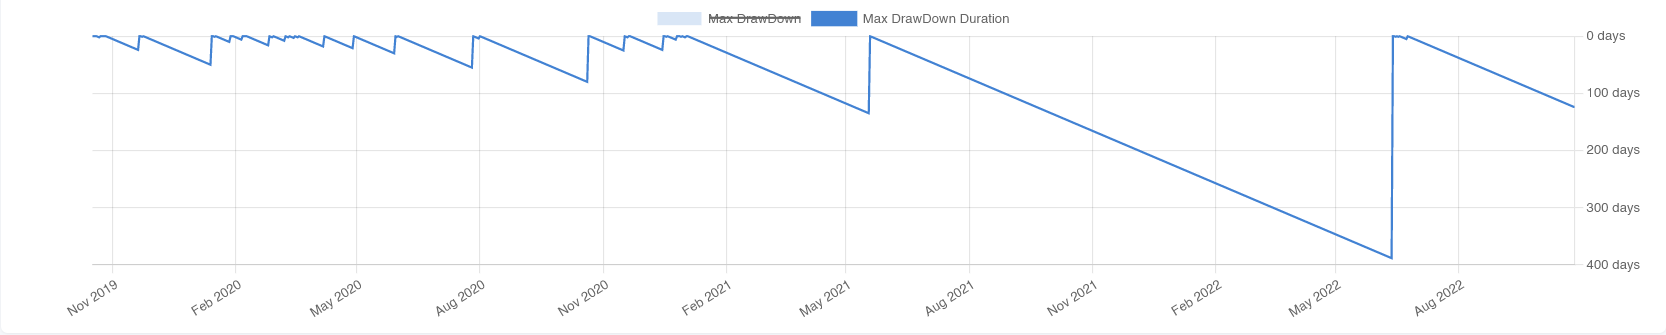
The second one displays the time spent in drawdowns. Thanks to him, you can extremely quickly navigate in erroneous moments, and without spending a lot of time searching for errors, transgress to their solution.By clicking on the explanation of any chart, you can turn off its display and in turn it on with another clickAll graphs link absolute, relative, and time scales. When using them, the time of an approximate analysis is significantly accelerated, because you do not need to hover over each point with the mouse to understand its performance. The absolute scale displays the underlying asset of the portfolio (tether or bitcoin), the relative scale shows percentages, and the time scale shows the date of an event.
We are constantly working on increasing the number of informative tools on the platform to help traders analyze statistics even better.