Profitable Strategies for a Sideways Market

Contents
- Introduction
- What is a Flat Market and Why Does It Occur
- Key Characteristics of a Flat Market
- Strategies for Trading in a Flat Market
- Trader Psychology in Flat Markets
- Pros and Cons of Trading in a Flat Market
- How to Avoid Mistakes When Trading Flat Markets
- Conclusion
Introduction
Definition of Flat and Sideways Market
A flat market is a condition in which the price remains within a narrow range, exhibiting no significant upward or downward trend. On a chart, this looks like an almost horizontal line with minor fluctuations. This type of movement is called sideways, as the price moves sideways rather than in an upward or downward direction.
Importance of Understanding Flat Markets for Successful Trading
Many traders are accustomed to trend conditions, when prices are rising or falling. In a flat market, such strategies often result in losses due to false signals. Without recognising that the market has entered a sideways phase, traders risk opening positions in the wrong direction and losing money. The ability to identify flat market conditions enables the selection of suitable strategies and the avoidance of common pitfalls.
Overview of Strategies for Profiting in a Sideways Market
There are specific techniques that work well during flat market conditions. These strategies do not attempt to predict the future direction of the market, but instead capitalise on recurring movements within a defined range. This article will examine such strategies and how to apply them in practice to earn consistently in a sideways market.
What is a Flat Market and Why Does It Occur
Explanation of the Term “Flat”
A flat market is a scenario where the price does not rise or fall significantly but instead fluctuates within a defined range. For example, the cost might remain between 100 and 110 for an extended period. This is a flat. During such times, the market pauses, waiting for new developments or news.
Causes of a Sideways Market: Lack of Trend, Supply and Demand Balance
Flat markets occur when buyers and sellers are equally strong, resulting in a balance of power between them. Neither side can dominate, so the price remains within a narrow band. Another reason is the absence of impactful news. Without fresh signals to shift trader sentiment, the price remains stagnant. A flat may also follow a strong trend, as participants take profits and wait for further direction.
Impact of Flat Markets on Traders
Flat markets can be confusing. Many trend-based strategies perform poorly under such conditions, generating false signals and sharp reversals. This can lead to emotional trading and losses. However, recognizing a flat market and applying suitable methods allows traders to profit even in such environments. The key is to remain patient and follow a well-planned approach.
Key Characteristics of a Flat Market
Duration of a Flat Market
A flat can last from several hours to several weeks, depending on market activity and relevant news. Sometimes it lasts a single day; other times, it may persist for extended periods. Traders should not expect an immediate breakout but rather learn to capitalize on the flat condition.
Channel Boundaries and Support/Resistance Levels
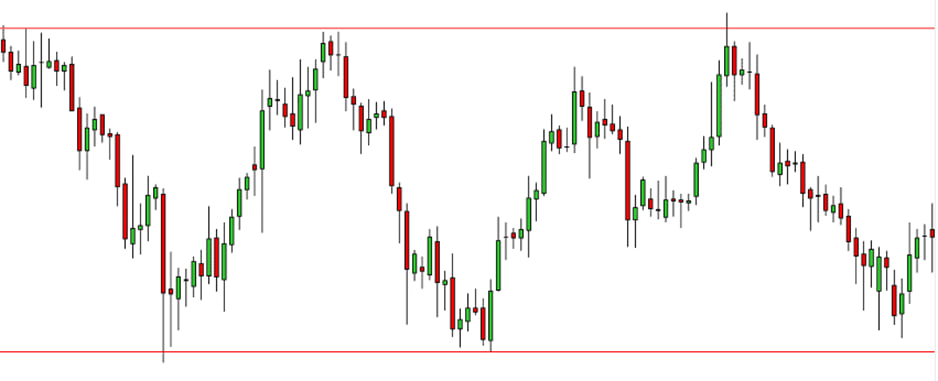
During a flat market, the price oscillates between two levels — support (the lower bound) and resistance (the upper bound). Support is the point at which the price typically stops falling and begins to rise, while resistance is the point at which it halts its climb and turns downward. These levels form the channel within which the price moves.
Price Behaviour in Flat Conditions
In a flat market, price movements are generally smooth and confined. They occur without large volumes, and news is scarce, so traders refrain from opening prominent positions. The price tends to repeat predictable actions — reaching resistance and reversing downward, or touching support and bouncing upward. This pattern can be leveraged for trading.
Strategies for Trading in a Flat Market
Trading on Rebounds from Channel Boundaries
Strategy Principles
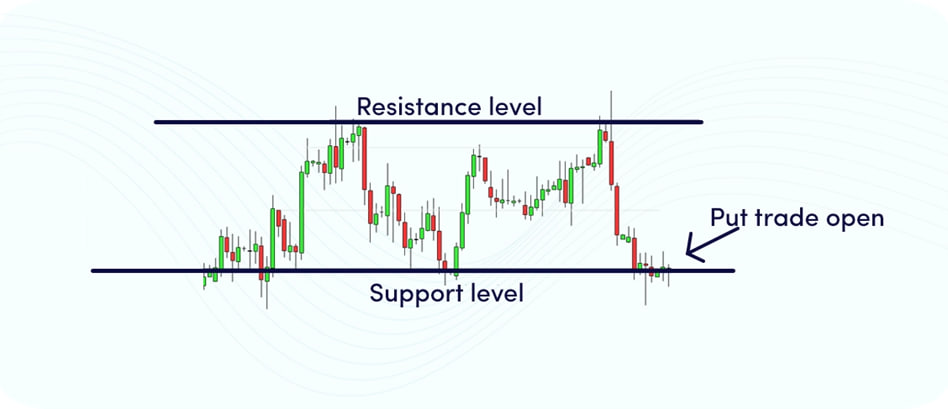
The core idea is simple: the trader waits for the price to reach either the support or resistance level. If the price approaches support and doesn’t break through, it’s a buy signal. If it nears resistance and starts to drop, it’s a sell opportunity. This approach remains effective as long as the price stays within the flat channel.
How to Identify Support and Resistance Levels
To identify support, look for points where the price has previously stopped falling and started to rise. The level should be confirmed at least twice. The same applies to resistance — find where the price previously failed to move higher. Use timeframes of 15 minutes or longer. The more frequently the price bounces off a level, the stronger it is.
Breakout Strategy
How the Breakout Strategy Works
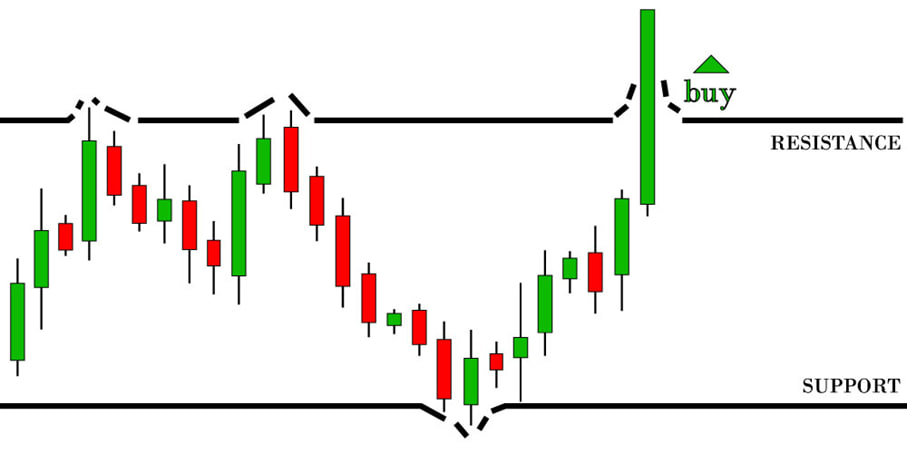
During a flat, the price stays within a channel. Eventually, it breaks through one of the boundaries — this is a breakout. If the price breaks above resistance and holds, it’s a potential buy signal. If it drops below support, a short position might be considered. This strategy is ideal for those seeking early entry into a new trend.
Risks and Potential Rewards
Breakouts often lead to fast price movements, presenting quick profit opportunities. However, there are risks. Sometimes, the price breaks a level but quickly returns, indicating a false breakout. Losses can occur without a stop-loss. To reduce risk, wait for confirmation, such as a candle closing beyond the level with increasing volume.
How to Avoid False Breakouts
Avoid entering trades immediately after touching a level. Wait for the price to hold beyond the channel boundary. Watch volume — rising volume during a breakout strengthens the signal. Use indicators or wait for a retest to confirm the breakout’s validity.
Indicators for Trading in a Flat Market
Popular Indicators: RSI, MACD, Stochastic
Several indicators are effective in flat markets. RSI identifies overbought or oversold conditions. MACD shows the direction of price movement. Stochastic is similar to the RSI, but it reacts faster. These tools help detect potential reversals.
How to Use These Indicators in Sideways Markets
In a flat market, indicators can guide entry points near channel boundaries. For example, if RSI indicates oversold conditions near support, it may signal a buying opportunity. If Stochastic shows overbought conditions at the resistance level, it may indicate a potential selling opportunity. Avoid relying solely on indicators — combine them with level analysis for better results.
Transition from Flat to Trending Market
A flat market doesn’t last forever. At some point, a new trend begins. To catch it early, monitor volume and sharp price moves. A breakout with substantial volume could signal the start of the trend. When this happens, shift from flat strategies to trend-trading methods.
Trader Psychology in Flat Markets

How to Manage Emotions While Trading in a Sideways Market
Flat markets often require prolonged waiting periods for signals, which can lead to boredom or impatience. Some traders open positions simply to stay active, which can lead to poor decisions. Understand that trading during flat periods demands patience. Confidence comes from having a plan and sticking to it.
Common Mistakes to Avoid
The main mistake is entering trades without signals. Another is setting stop-losses too tight — small false movements can easily trigger them in a flat market.
Importance of Discipline
Discipline helps preserve capital during flat markets. When a trader knows where to enter, exit, and place stop-losses in advance, they are less likely to make emotional decisions. This structured approach promotes consistency. Even if the market isn’t yielding profits yet, staying calm and following the plan is crucial.
Pros and Cons of Trading in a Flat Market
Pros: Stable Entries, Predictability
Price often rebounds from the same levels, making it easier to determine where to buy and sell. This predictability helps traders act calmly and confidently. Additionally, indicator signals are more reliable when prices touch range boundaries. This makes flat market trading an ideal environment for beginners to practice in a controlled setting.
Cons: Limited Profit Potential
Despite its stability, a flat market has limitations. Prices don’t move much, so large profits are unlikely. Trades within the range yield modest returns, necessitating more trades to generate a sufficient income. This increases the workload and time investment. Another drawback is false breakouts — price may move sharply beyond the range and then quickly return, which can be misleading and lead to losses without a clear strategy.
How to Avoid Mistakes When Trading Flat Markets

Developing a Trading Plan
Without a plan, emotions take over. In flat markets, it’s essential to decide in advance where to enter, exit, and how much risk to take. The plan should be straightforward and strictly adhered to. It must include support and resistance levels, as well as trade entry rules. This helps avoid confusion in the event of unexpected market behaviour.
Using Stop-Loss and Take-Profit Orders
To protect your capital, always set a stop-loss — an order to close a trade if the price moves in the wrong direction. It limits losses. A take-profit order secures profits at a predefined level. These tools are vital in flat markets, where price can quickly reverse at range edges. Stop-losses and take-profits remove emotional decision-making and help preserve results.
Market Analysis and Strategy Adjustment
A flat market can end at any time. Stay alert to market changes. When signs of a breakout appear, adjust your strategy. Don’t rely on a single approach in all conditions. The market evolves, and your plan should too. Monitor volume, candlestick patterns, and news. If a trend emerges, switch to trend-based methods. Flexibility is key for trading success.
Conclusion
Flat market trading is suitable for those who value stability and want to practice in a calm environment. It provides clear signals and helps build emotional control. However, it is not a period for high profits. Caution, a solid plan, and the ability to step back at the right time are crucial. By following the rules and observing the market, a flat market can become a productive stage in a trader’s development.