Support & Resistance Levels: How to Identify Them
Contents
- Introduction
- What Are Support and Resistance Levels
- How to Identify Support and Resistance Levels
- How to Draw Support and Resistance Levels on the Chart
- Why Support and Resistance Levels Can Change
- Using Support and Resistance Levels in Trading
- Examples of Trading With Support and Resistance Levels
- Conclusion
Introduction
Support and resistance levels are fundamental benchmarks for any trader. They help determine where the price might pause, reverse, or continue its movement. Without these levels, building a strategy becomes difficult, as the market appears chaotic.
If traders know how to identify such levels, they will better understand price behaviour. This helps them foresee potential entry and exit points in advance. Therefore, the ability to define support and resistance is a vital skill that increases the chances of making a profit.
What Are Support and Resistance Levels
Definition of a Support Level
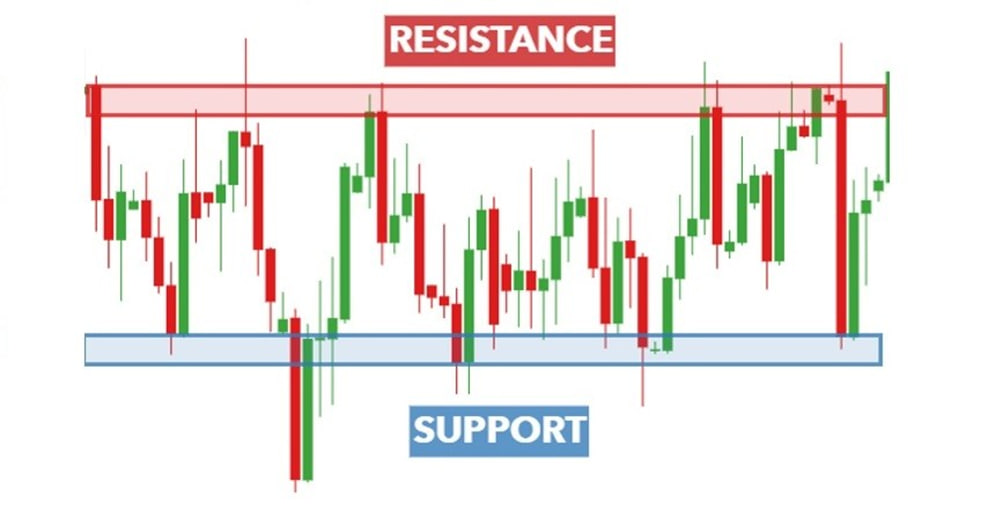
A support level is a price point below which an asset doesn’t fall for long. When the price drops to this level, traders begin to buy, and the price bounces back up. There is a high demand in this zone.
Definition of a Resistance Level
A resistance level is the opposite scenario. The price reaches a certain point but fails to break through it upwards. At that moment, traders start selling, and the price pulls back. This zone sees a lot of supply.
The Difference Between Them and Their Role in Technical Analysis
The main difference is the direction. Support holds the price from below, while resistance holds it from above. These levels play a crucial role in analysis. Traders use them to find entry and exit points, and places to set stop-losses.
How to Identify Support and Resistance Levels
Using Historical Prices
One of the simplest methods is to look at where the price frequently stopped in the past. If the price bounced several times from the same upward or downward level, that indicates a strong level, either support or resistance.
Chart Patterns Like “Double Tops” and “Double Bottoms”
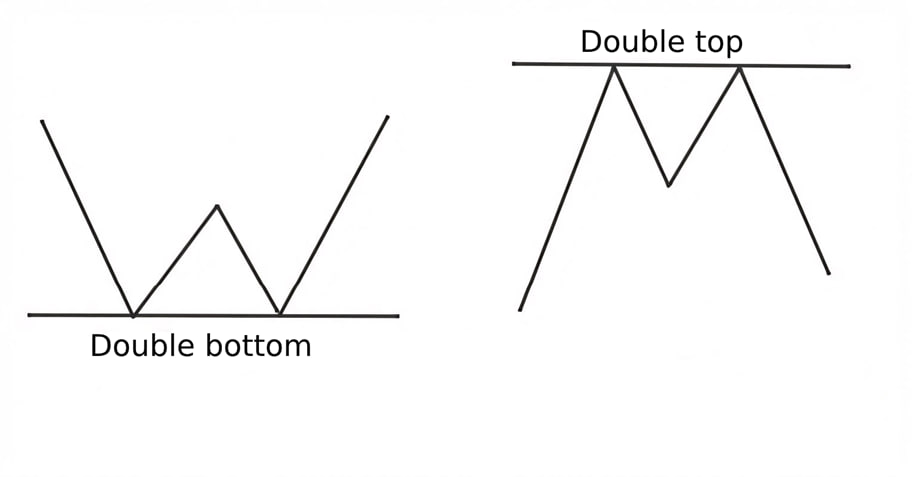
Some patterns show where the price cannot move further. For example, a “double top” means the price attempted twice to break through a level and failed, signalling strong resistance. A “double bottom” represents two rebounds from a support level.
Reversal Points
If there’s a sharp reversal up or down on the chart, it’s worth noting that price level. Critical levels often appear at these points. These zones are visible even to beginners: the price moves in one direction, then suddenly changes course. Such points usually become new levels in the future.
The Market on Different Timeframes
It’s essential to look at charts of varying scales. For example, a level visible on the daily chart might be stronger than one on the hourly chart. It becomes essential if the same level is visible on multiple timeframes.
How to Draw Support and Resistance Levels on the Chart
Step-by-Step Guide to Drawing Horizontal Lines
-
Open the chart of the selected asset.
-
Switch to the daily or four-hour timeframe.
-
Find areas where the price has repeatedly bounced up or down from the same level.
-
Draw a horizontal line through these points. It’s not necessary to hit the exact high or low — what matters is that the line goes through a zone where the price has reacted frequently.
-
Repeat the same steps for other parts of the chart. The more touches a level has, the stronger it is.
-
Check how the price behaved at these levels before. If it is reversed or slowed down, the level is likely valid.
Why Support and Resistance Levels Can Change
The Role of News and Economic Events
News can drastically change market sentiment. For example, if poor economic data is released or a company publishes a weak report, the price may break through support. On the other hand, good news can break resistance. Following the news is essential, especially when key data is released.
Market Psychology and Trader Behaviour
Emotions and collective perception primarily drive market participant behaviour. When prices rise, many experience the fear of missing out (FOMO), prompting them to buy at the top. Conversely, panic sets in during declines, and people sell even at a loss just to “save” their remaining capital. These emotional responses create the market’s wave-like movements and often increase volatility.
Technical support and resistance levels work as long as most traders believe in them and act accordingly. For instance, if the $20,000 level previously served as strong support and triggered buying, that happened because the market as a whole viewed it as a good entry point. But if interest in buying at that level fades — whether due to negative news, changing sentiment, or new price benchmarks — the level loses its strength. This reflects the essence of market psychology: no level works independently; it only works as long as the masses believe in it.
The Influence of Large Market Participants
Big players can move the price even without news. They enter the market with large volumes and can break long-held levels. After that, the market starts reacting differently. What was previously support may become resistance, and vice versa.
Using Support and Resistance Levels in Trading
Using Levels to Enter the Market
Support and resistance help traders identify where buying or selling is advantageous. These are not just lines on a chart — they’re zones where price previously stalled or reversed. If the price approaches such a zone again, there’s a chance it will bounce again.
For example, if Bitcoin repeatedly bounced off the $25,000 level, it suggests many buyers are present there. A trader might open a long position if the price falls to that zone again, expecting the pattern to repeat. They would place a stop just below the level. If the level fails, the loss is minimal. But if the price bounces again, the profit could be several times the risk.
The same works with resistance. If the price often reverses at $30,000, a trader might open a short when it returns to that level. The expectation is that sellers will be active again, and the price will decline.
The main advantages of trading from different levels are a clear entry point and a stop-loss, which help control risk.
Risks and How to Avoid False Signals
Levels are not guarantees. Sometimes, the price breaks through them and immediately returns. This is called a false breakout. Such moments often confuse traders. They enter a trade thinking the level is broken, only for the price to reverse sharply.
To avoid this, it’s important not to rush. One method is to wait for the candle to close. The breakout might be real if the candle closes confidently beyond the level and the next one continues the move.
Another method is to watch the volume. If volume is low during the breakout, it could be a false signal. Real moves are often accompanied by rising volume, indicating that big players are entering the market.
Also, consider the time of day. False breakouts often happen during low-liquidity periods, such as nighttime or weekends. Trading during active sessions is better — price behaviour is more predictable.
Using Levels in Combination With Other Indicators
Levels work best when combined with other tools. This increases confidence in decisions. For example:
-
RSI (Relative Strength Index) shows whether the market is overbought or oversold. The upward move may end if the price approaches resistance and RSI shows overbought conditions. That’s a good moment to look for a sell entry.
-
MACD helps determine the trend direction. If the price is at support and the MACD turns upward, it strengthens the buy signal.
-
Volume is also essential. If the price approached the level on high volume and stopped, this can be a strong signal.
Combining levels with other signals helps traders understand where the market is ready to reverse or continue. This prevents random decisions and supports actions based on real data.
Examples of Trading With Support and Resistance Levels
Example of a Successful Trade Based on Support Level
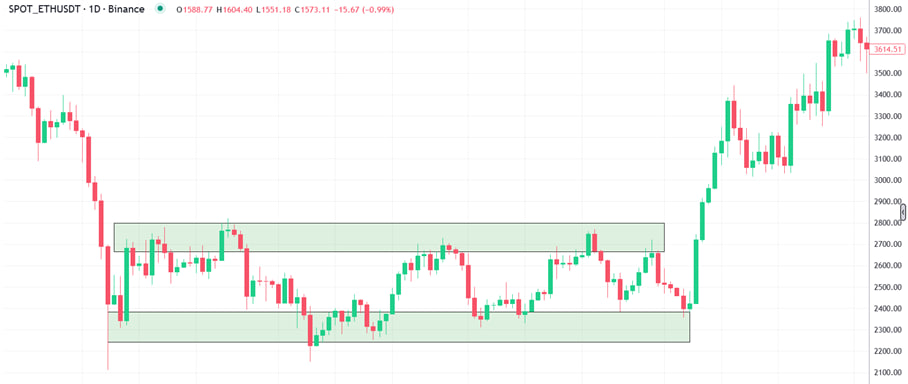
After a prolonged decline, Ethereum’s price approached a key support zone around $2,200–$2,400. This area had previously been a reversal point, showing strong buyer interest. As the price neared the zone, signs of slowing emerged: red candles became smaller, followed by a strong bullish candle with a long lower wick — a potential reversal signal. The next candle closed higher, confirming buyer activity and market readiness for a bounce.
After the reversal confirmation, the entry was made at $2,450—slightly above support. A stop-loss was placed below the zone at $2,200, beyond the local low. The target was the resistance zone of $2,850–$2,900. The trade showed strong momentum: the price surged and confidently reached the target, demonstrating a classic support bounce scenario.
Example of a Successful Trade Based on Resistance Level
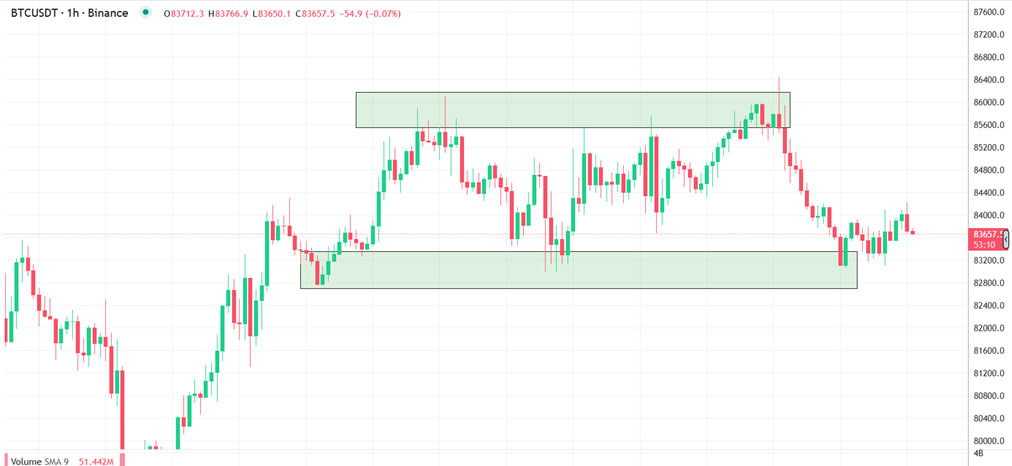
The price approached the resistance zone at $85,500–$86,000, from which it had previously dropped. Upon the retest, signs of weakening buyers appeared: trading volume started to decrease, and candles became less confident, hinting at a potential reversal. A key signal was a reversal candle with a long upper wick, formed right within the resistance zone. The following candle closed below the body of the previous one, confirming seller activity and justifying a short entry.
The entry was made at $85,800. The stop-loss was set above the zone at $86,250, and the take-profit was placed at $83,200 — near the support zone. The price followed the expected scenario — after the reversal signal, a sharp drop occurred, and the trade closed successfully with a profit.
Conclusion
Support and resistance levels are simple yet powerful tools. They help determine where to open and close positions. These levels work in any market and across different timeframes. The key is to learn how to identify them correctly and not rush. The more experience you have, the more accurate your decisions will become.