Key Technical Analysis Indicators: SMA, EMA, and Bollinger Bands

Contents
- Introduction
- What Are Indicators
- Simple Moving Average (SMA)
- Exponential Moving Average (EMA)
- Bollinger Bands
- Differences in Calculations and Usage
- Comprehensive Strategy for Trading with These Indicators
- Conclusion
Introduction
General Introduction to Technical Analysis
Technical analysis is a method of forecasting the price fluctuations of financial instruments based on studying their historical dynamics. Unlike fundamental analysis, which assesses an asset’s intrinsic value, technical analysis focuses on identifying recurring price patterns and trends. The key concept is that the current market price reflects all available information, and price movements follow specific patterns that can be recognized and applied in trading.
Why Indicators Are Important for Investors and Traders in Decision-Making
Indicators help traders build more informed strategies. They can be used to determine the direction of a trend and identify the best moments to enter or exit a trade. Based on mathematical calculations and statistical data, indicators help minimize the likelihood of erroneous decisions by eliminating subjective judgments.
What Are Indicators
Definition of Technical Analysis
Technical analysis is a set of methods that traders use to study an asset’s past price data to predict future market movements. This approach is based on analyzing charts that display price changes over time. Technical analysis assumes that the market follows recurring patterns, and the trends identified in the past can help forecast future developments.
The Role of Indicators in Predicting Price Movements
Indicators help identify prevailing trend directions, market movement changes, other traders’ activity, and key levels for an asset. Some indicators are based on price averaging, while others analyze trading volumes or the rate of price changes. They provide additional data, enabling traders to make more informed and well-grounded decisions.

Classification of Indicators
There are several categories of technical indicators:
- Trend Indicators help identify the price movement trend and determine long-term market tendencies.
- Oscillators analyze changes in trading volume and allow trader activity in the market to be tracked.
- Volume Indicators are used to anticipate trend reversals and detect overbought or oversold conditions of an asset.
- Volatility Indicators determine the level of price fluctuation and potential zones of price range expansion or contraction.
Simple Moving Average (SMA)
Definition and Working Principle of SMA
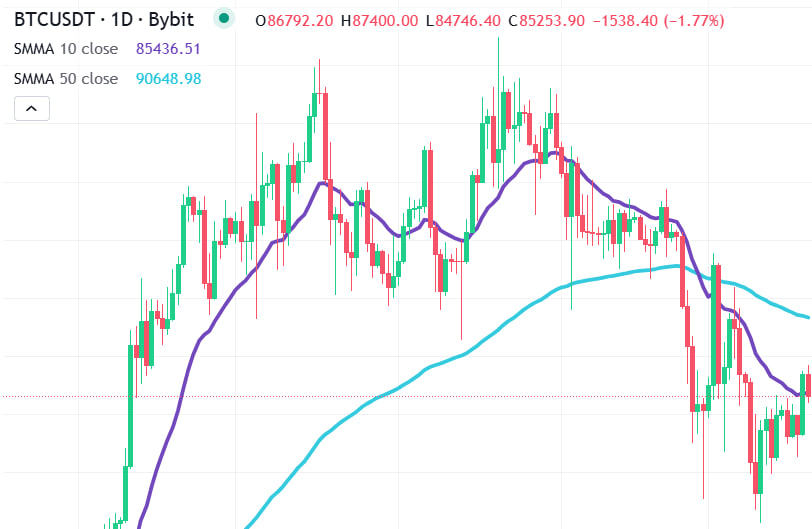
The Simple Moving Average (SMA) is an indicator designed to determine trend direction and smooth out price fluctuations. Simply put, it represents the average price of an asset over a specific period. For example, a 10-day SMA is calculated as the arithmetic mean of the closing prices over the last 10 trading days and updates as new data comes in.
Traders widely use this indicator to analyze market trends:
- An upward-moving SMA indicates asset growth.
- A downward-moving SMA signals a price decline.
SMA Calculation
The SMA formula is simple: sum the closing prices over a specified time frame and divide the result by the number of days. Each new trading session replaces old data with new data, recalculating the average.
An extended period (50–200 days) creates a smoother SMA line, which helps identify long-term trends, but the SMA reacts slower to price changes. Short periods (10–20 days) increase sensitivity to market changes but may result in more false signals.
Advantages and Disadvantages of Using SMA
Pros:
- Easy to use and understand.
- Effectively identifies long-term trends.
- It can be used as a dynamic support or resistance level.
Cons:
- Lag due to the use of historical data.
- Potential to generate false signals in sideways markets.
- Not always responsive to sharp price changes.
SMA Application in Trading
The SMA can be used in several ways:
- Determine the current trend direction (price above the SMA indicates an uptrend, and below indicates a downtrend).
- Identify support and resistance levels.
- Generate trading signals:
- Price crossing the SMA from below is a potential buy signal.
- Price crossing the SMA from above is a potential sell signal.
- Combine with other indicators to improve analysis accuracy.
Exponential Moving Average (EMA)
Definition and Difference from SMA
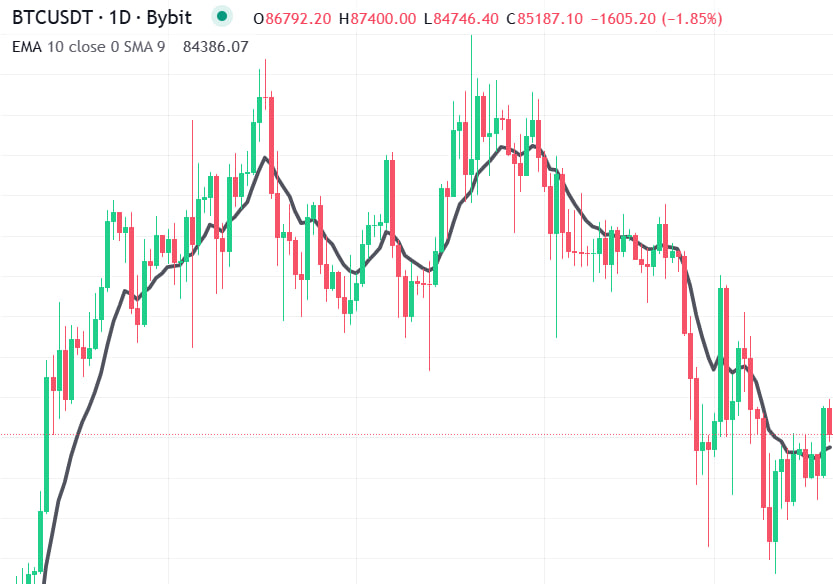
The Exponential Moving Average (EMA) tool differs from the Simple Moving Average (SMA) by focusing more on recent price data.
The EMA is much more dynamic than the SMA and is especially useful for short-term trading. Its key feature is its faster response to market movements.
Advantages of EMA Compared to SMA
- Increased responsiveness to price changes allows traders to adapt to market conditions quickly.
- Higher sensitivity to trends provides more timely signals about the start or end of market movements.
- More effective noise filtering and smoothing of fluctuations compared to the SMA.
However, it also has drawbacks:
- Greater sensitivity can lead to more false signals.
- Sometimes, the SMA may be a more stable indicator for long-term analysis.
EMA Calculation
The EMA formula incorporates not only the average price of an asset over a specified period but also a smoothing factor that emphasizes recent prices. The shorter the EMA period, the more it reacts to market fluctuations.
For example:
- A 10-period EMA quickly adapts to changes but may respond more frequently to random spikes.
- A 50-period EMA is smoother and better suited for identifying long-term trends.
Practical Application of EMA
Trend Analysis: Identifying upward or downward trends based on price positioning — if the price is above the EMA, the trend is upward; if below, the trend is downward.
Finding Entry and Exit Points: The EMA is often used to determine favorable moments for buying or selling assets.
EMA Crossover Strategy:
- The crossover of a shorter EMA (EMA-9) above a longer EMA (EMA-21) is a potential buy signal.
- The crossover of a shorter EMA below a longer EMA is a potential sell signal.
Bollinger Bands
Definition and Working Principle of Bollinger Bands
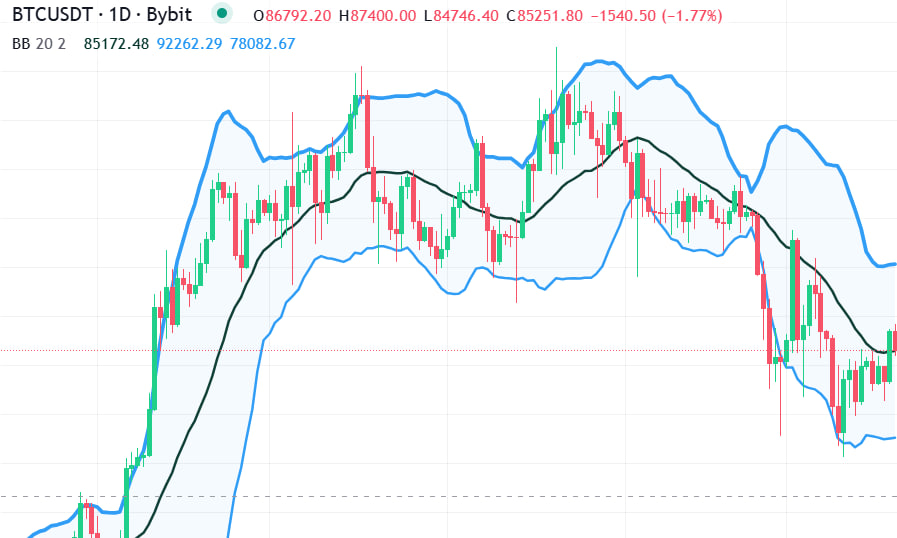
Bollinger Bands are an indicator of market volatility and potential price reversals. It consists of three lines forming an adaptive price corridor around an asset’s chart.
The core principle is that the price typically stays within these boundaries. If the range expands or contracts, it indicates rising or falling market activity.
Components of Bollinger Bands
The indicator includes three main lines:
- Middle Band — This is the SMA, which shows the primary price direction.
- Upper Band — Calculated by adding the standard deviation, multiplied by a factor (usually 2), to the middle band. It marks the upper limit of normal price movement.
- Lower Band — The central SMA minus the standard deviation multiplied by the same factor. This line sets the lower limit of the range.
The standard deviation shows how much the price deviates from the average level. When the price touches the upper or lower band, it may indicate overbought or oversold conditions.
How to Interpret Wide and Narrow Ranges
- Wide Range: Signals high market volatility and active price fluctuations. This behavior often precedes significant price changes.
- Narrow Range: This indicates a period of market calm, which is often followed by a sharp impulse in either direction.
Using Bollinger Bands to Identify Volatility and Overbought/Oversold Levels
Market Volatility:
- Band expansion indicates increased fluctuations, while contraction indicates reduced activity.
Identifying Overbought and Oversold Levels:
- When the price approaches the upper band, a downward pullback is more likely, signaling that the asset may be overbought.
- When the price nears the lower band, an upward reversal might occur, indicating the asset could be oversold.
Generating Trade Signals
- Breaking Through the Upper or Lower Band: This may suggest continuing the current trend.
- Sharp Breakout Beyond Narrow Bands: Signals the potential start of a powerful new movement.
Differences in Calculations and Usage
- SMA — the average price of an asset over a specific period. It smooths out fluctuations but reacts slowly to new changes.
- EMA — focuses on current prices, making it more reflective of recent market changes.
- Bollinger Bands — built on the SMA with added upper and lower bands calculated using standard deviation. This indicator helps assess volatility and anticipate potential reversals.
Where They Are Used
- SMA is suitable for long-term analysis and identifying trends.
- EMA is ideal for short-term trading as it quickly reflects price changes.
- Bollinger Bands helps traders analyze market volatility and identify overbought or oversold conditions.
Choosing an Indicator Based on Strategy
- For Long-Term Investing, SMA is used to assess global trends. Moving averages with 50 and 200 periods help identify long-term trends.
- For Short-Term Trading, the EMA allows for quicker signals of price direction changes. Combining EMA-9 and EMA-21 is often applied in scalping and intraday strategies.
- For Volatile Markets: Bollinger Bands help detect moments when the price moves beyond standard boundaries, which may indicate a reversal or strengthening of the current trend.
Advantages and Disadvantages of Each Indicator
| Indicator | Advantages | Disadvantages |
| SMA | Simple to calculate and reliable for long-term analysis. It helps identify trends. | Lags in reacting to price changes. Not suitable for fast trading. |
| EMA | More dynamic. Ideal for short-term strategies. | It can give false signals due to high sensitivity. |
| Bollinger Bands | It helps assess volatility and identify overbought/oversold conditions. | Sometimes, the price stays outside the bands. |
Comprehensive Strategy for Trading with These Indicators
Combining SMA and EMA to Identify Trends
Using the SMA-200 and EMA-50 helps track long-term and medium-term market trends.
- When the EMA-50 crosses the SMA-200 from below, it could be a buy signal.
- If the EMA-50 crosses the SMA-200 from above, it could indicate a sell signal.
Bollinger Bands for Assessing Market Dynamics
- If the price is near the lower band, this may indicate oversold conditions and a potential upward reversal.
- If the price reaches the upper band, it may signal overbought conditions and a possible price decline.
- When Bollinger Bands tighten (the “squeeze” effect), it often precedes a substantial price movement.
Trading Strategy Using All Three Indicators
- Identifying the Trend:
- The SMA-200 helps determine the overall price direction.
- Receiving Trade Signals:
- If the price is above the SMA-200, consider long positions.
- If the price is below the SMA-200, consider short positions.
- The EMA-50 helps refine the entry points.
- Confirming the Signal with Bollinger Bands:
- This could be a potential entry point if the price is near the lower band in an uptrend.
- This could signal a selling opportunity if the price is near the upper band during a downtrend.
- Filtering False Signals:
- If the price crosses the EMA-50 but stays in the middle of the Bollinger Bands range, it is better to wait for additional confirmation before entering a trade.
Conclusion
SMA, EMA, and Bollinger Bands are practical technical analysis tools that serve distinct purposes:
- SMA is suitable for identifying long-term trends.
- EMA reacts faster to price changes, making it valuable for short-term strategies.
- Bollinger Bands help assess volatility and identify potential reversal points.
Combining two or three indicators improves the accuracy of trade signals and helps avoid impulsive decisions. However, it is crucial to test the indicators in practice and adapt the strategy according to market conditions.