Next-Generation Indicators: What Top Traders Use in 2025
Contents
- Introduction
- Changes in Financial Markets in 2025
- Reasons for the Emergence of New Indicators
- Traditional Indicators vs. Next-Generation Indicators
- Features of Next-Generation Indicators
- Popular Indicators Among Top Traders in 2025
- How to Choose the Right Indicator for Your Strategy?
- The Future of Indicators in Trading
- Enhancing Indicator Accuracy and Speed
- The Role of Traders in Adapting to New Tools
- Conclusion
Introduction
Indicators are essential tools that traders use to analyse the market and identify trading opportunities. They help recognise patterns in price movements, determine trend reversals, and assess market sentiment. Over time, approaches to using indicators evolve, with new algorithms emerging that consider modern market conditions and technological advancements.
In this article, we will explore how the approach to using indicators has changed in 2025, which modern methods are preferred by top traders, and how innovations enhance signal accuracy. We will also discuss the selection of indicators for a strategy, their combination, and market prospects.
Changes in Financial Markets in 2025
In recent years, financial markets have become even more dynamic due to several key factors:
-
The rise of algorithmic and high-frequency trading.
-
The expanded use of artificial intelligence and machine learning in data analysis.
-
The growing role of decentralised finance (DeFi) and digital assets.
-
Increased regulatory oversight and changes in liquidity structure.
These trends influence market analysis methods and drive the development of new indicators.
Reasons for the Emergence of New Indicators
Modern indicators are developed with current challenges and opportunities in mind:
-
Processing large volumes of data – Traditional methods cannot always handle real-time data streams.
-
Increased market volatility – More precise detection of price dynamics changes is required.
-
Use of artificial intelligence – Machine learning enables the creation of indicators that adapt to changing conditions.
-
New asset classes – Digital currencies and tokenised assets require specialised analytical tools.
Traditional Indicators vs. Next-Generation Indicators
Brief Overview of Traditional Indicators Used in Trading
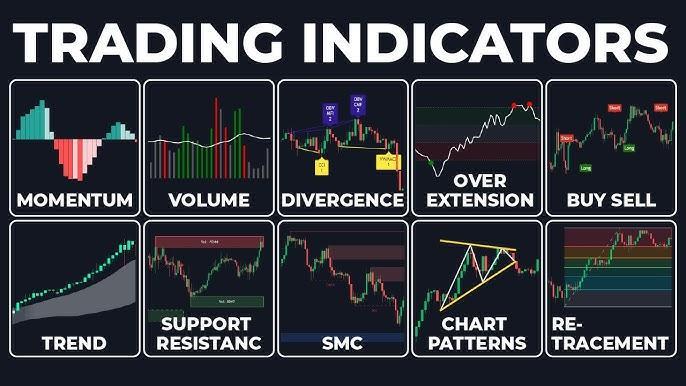
Traditional technical analysis indicators have been used in trading for decades. They are based on mathematical formulas that utilise historical price and volume data, helping traders identify trends, entry, and exit points. Some of the most popular include:
-
Moving Averages (MA, EMA, SMA) – Show the average price over a specific period and help determine trend direction.
-
Relative Strength Index (RSI) – Measures the speed and magnitude of price movements, indicating whether an asset is overbought or oversold.
-
MACD (Moving Average Convergence Divergence) – Helps identify trend changes by comparing two moving averages.
-
Bollinger Bands – Measure market volatility and indicate potential reversal points.
-
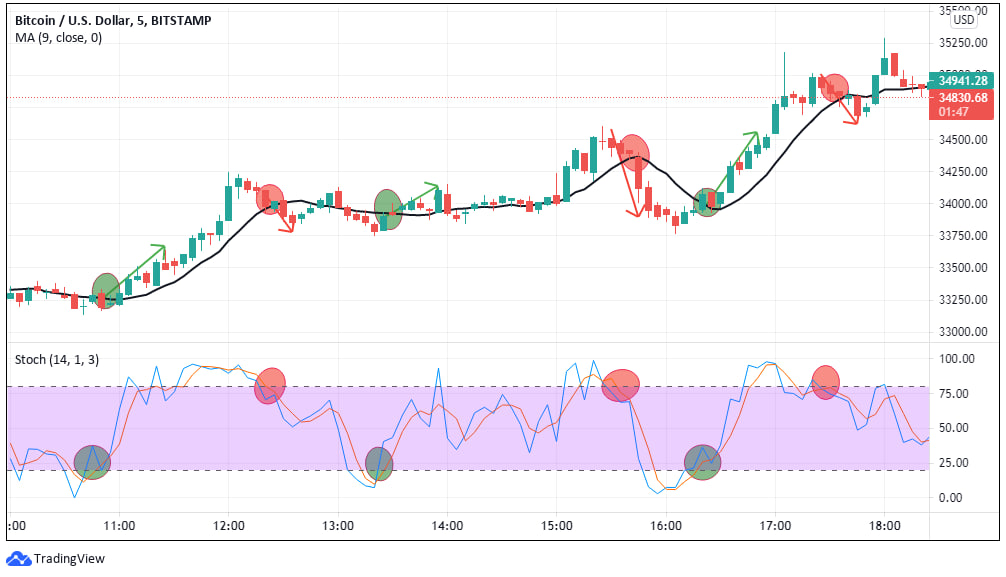
Stochastic Oscillator – Signals potential trend changes.
These indicators are widely used in trading strategies, but modern market conditions require more precise and adaptive tools.
Advantages and Disadvantages of Traditional Methods
Advantages:
- Simplicity of use and wide availability.
- Proven effectiveness based on historical data.
- Ability to be combined with other technical and fundamental analysis methods.
Disadvantages:
- Signal lag – Indicators rely on historical data.
- Inability to adapt to changing market conditions in real time.
- Ignoring alternative data sources like news, social media, and market anomalies.
Traders’ Need for More Accurate and Faster Solutions
The approach to data analysis is evolving. Markets are becoming more complex and volatile:
-
High volatility demands tools that can react quickly to sharp price movements.
-
Algorithmic trading dominates the markets, making traditional indicators less effective.
-
Growing data volumes require considering not just chart patterns but also information from news, social media, and transaction flows.
-
Automation allows traders to use adaptive algorithms that adjust indicator parameters based on market conditions.
All these factors have contributed to the emergence of next-generation indicators that utilise artificial intelligence, machine learning, and big data analysis.
Features of Next-Generation Indicators
Modern financial markets require more precise, adaptive, and fast-responding analytical tools. Next-generation indicators utilise advanced technologies, allowing traders to consider more factors when making decisions.
Innovative Approaches and Technologies in Indicator Development
Unlike traditional methods based on simple mathematical formulas, new indicators employ:
-
Big Data and Machine Learning – Analyze vast amounts of information to identify hidden patterns.
-
Adaptive Analysis Algorithms – Adjust parameters according to current market conditions.
-
Hybrid Models – Combine technical and fundamental analysis elements, incorporating macroeconomic indicators and market sentiment.
Indicators have become more flexible and capable of adapting to the changing market environment.
Application of Artificial Intelligence and Machine Learning
Key areas of AI usage in indicators include:
-
Training on historical data – Identifying patterns not visible through traditional analysis.
-
Self-learning models – Algorithms that improve their predictions over time.
-
Recognition of market anomalies – Detecting non-obvious signals that may indicate trend changes.
Machine learning transforms indicators from simple analytical tools into dynamic systems capable of adapting to market changes.
Incorporating New Data: Cryptocurrencies, Social Media, News, and Events
Technical factors, news, social media, and public sentiment influence modern markets.
Next-generation indicators take into account:
-
The cryptocurrency market – Analyzing blockchain transaction flows, wallet activity, and miner behavior.
-
Social media – Monitoring Twitter, Reddit, Telegram, and other platforms to identify trends and sentiment shifts.
-
News streams – Analyzing real-time headlines and key terms to predict market reactions.
Increased Accuracy and Data Processing Speed
One of the key advantages of new indicators is their high-speed data processing. They can:
- Analyse data in real time and instantly generate signals.
- Consider multiple factors, reducing the number of false signals.
- Operate under high volatility conditions without losing forecast accuracy.
Popular Indicators Among Top Traders in 2025
Modern traders use indicators that account for not only price data but also a wide range of external factors. In 2025, the most in-demand algorithms are based on neural networks, alternative data sources, and multi-factor analysis.
Example 1: Neural Network and Deep Learning-Based Indicators
Indicators powered by neural networks can identify complex patterns in market data, adapt to changing conditions, and optimise parameters.
How They Work:
-
Use neural networks to analyse historical data and identify hidden patterns.
-
Train on large datasets and adapt to the current market situation.
-
Provide forecasts based on probabilistic market development scenarios.
Example Indicators:
-
DeepTrend AI – Predicts trend directions by analysing data from various markets and assets.
-
Adaptive Neural RSI – An enhanced version of RSI that adjusts its parameters based on volatility.
These indicators are beneficial for short-term and algorithmic trading strategies.
Example 2: Indicators Using Data from Alternative Sources (Social Media, News)
The information environment heavily influences market movements. Indicators that analyse news headlines, social media posts, and investor sentiment can predict unexpected asset dynamics.
How They Work:
-
Analyse posts on Twitter, Reddit, Telegram, and other social networks.
-
Use Natural Language Processing (NLP) to assess news headlines.
-
Evaluate sentiment and hype levels around specific assets.
Example Indicators:
-
SentimentWave – Measures market sentiment based on social media and news data.
-
NewsImpact Index – Determines asset growth or decline likelihood based on news sentiment.
Example 3: Multi-Factor Indicators Combining Various Data Types
Traditional indicators analyse a limited set of parameters, whereas multi-factor indicators integrate data from multiple sources, including technical analysis, fundamental indicators, market sentiment, and macroeconomic statistics.
How They Work:
-
Merge price, volume, news, and other data into a unified model.
-
Apply machine learning to identify the most significant factors for a specific market situation.
-
Automatically adjust parameters based on market conditions.
Example Indicators:
-
FusionQuant – Combines technical analysis data, corporate reports, and macroeconomic indicators.
-
SmartMomentum AI – Analyzes trading volumes, liquidity dynamics, and fundamental metrics to identify strong market movements.
Example 4: Indicators for Automatic Risk Adjustment and Strategy Optimization
Modern indicators help identify entry and exit points and manage risks. They analyse market conditions and suggest optimal settings for trading strategies.
How They Work:
-
Automatically adjust stop-loss and take-profit levels.
-
Analyse volatility and modify position sizes based on market conditions.
-
Consider asset correlations to reduce overall portfolio risks.
Example Indicators:
-
RiskOptimizer AI – Dynamically adjusts risk levels and trade volumes.
-
HedgeGuard – Analyzes asset correlations and recommends hedging tools to minimise losses.
How to Choose the Right Indicator for Your Strategy?
An indicator should align with your strategy, timeframe, and market. Trend-following strategies require tools that define movement direction (SMA, EMA, MACD). Oscillators are more effective in ranging markets. Volume indicators (OBV, VWAP) help analyse liquidity and confirm signals.
It’s essential to consider lag. Moving averages and MACD react to price with a delay but filter out noise. RSI and Stochastic provide early signals but can be misleading.
Risk and Accuracy Assessment
Before using indicators, evaluate their effectiveness:
- False Signals
- Oscillators often give early signals, which may be false.
- Trend indicators lag but are more suitable for long-term trading.
- Backtesting
- Test how indicators performed in the past using historical data.
- Risk-Reward Ratio
- The minimum ratio should be 1:2 (expected profit twice the risk).
- Win Rate
- For example, the strategy will be profitable if 60% of trades are profitable with a 1:2 risk-reward ratio.
Combining Indicators
Avoid using too many indicators of the same type
- Mistake: Using MACD, EMA, and ADX together, since all three indicate trends but don’t provide new insights.
Effective Combinations
-
Trend Strategy: EMA (50) + MACD + ADX
-
Range Strategy: RSI + Bollinger Bands
-
Momentum Strategy: VWAP + RSI + Stochastic
-
Volume Analysis: VWAP + OBV
Examples for Different Markets
Stock Market: EMA and MACD help track long-term trends, while VWAP is helpful for intraday trading. Cryptocurrencies: High volatility makes Bollinger Bands and RSI effective. Futures: CCI and VWAP help capture short-term moves, while ADX confirms trend strength.
The key is to test and adapt the strategy to current market conditions.
The Future of Indicators in Trading
Technological advancements are changing market analysis. AI and machine learning enable more adaptive indicators that consider price and volume and external factors such as news, social sentiment, and macroeconomic data.
Algorithms are becoming more sophisticated, and data processing is getting faster. Traditional indicators like MACD or RSI are already being enhanced with neural network models, which predict market changes based on multidimensional data.
Automated systems will increasingly replace manual analysis. AI will confirm trends and adapt to changing market conditions in real time. Big Data will reveal hidden patterns that traditional methods cannot detect.
Enhancing Indicator Accuracy and Speed
Modern computing power enables analysis of vast amounts of data in less time. High-frequency trading already uses algorithms that react to price changes in milliseconds.
Hybrid indicators combine classic technical analysis and AI to adjust to market conditions, reducing false signals. For example, AI-based oscillators could factor in volatility and adjust overbought/oversold thresholds dynamically.
The Role of Traders in Adapting to New Tools
Despite the rise of automation, the trader remains a key decision-maker. Technology simplifies analysis, but successful trading requires experience, discipline, and adaptability.
Traders who embrace new tools will gain an advantage over outdated methods. However, it’s crucial not to follow algorithmic signals mindlessly but to understand their logic, combining machine-driven insights with personal expertise.
Conclusion
The future of trading is deeply connected to technological evolution. Indicators are evolving from classic tools to intelligent algorithms that analyse price, volume, and multiple external factors. This improves signal accuracy and reduces false entries.
Automated systems make market analysis faster and more efficient, but the final decision still rests with the trader.
The best strategy is a balance between technology and experience, where traders use cutting-edge tools not for blind execution but for making informed decisions.