What Are Chart Patterns and How to Use Them in Trading?
Contents
- Introduction
- Definition and main types of patterns
- How to recognize chart patterns
- Practical use of patterns in trading
- Combining patterns with other analysis methods
- Advantages and disadvantages of using patterns
- Conclusion
Introduction
What are chart patterns?
Chart patterns are repetitive price structures that help traders determine price movement based on historical data. They are formed as a result of the behavior of market participants and can signal a continuation of the trend or its reversal.
Why are they important for traders?
Understanding graphical patterns creates many advantages for traders:
- Price movement analysis
Patterns help you determine whether the current trend will continue or reverse. This gives traders an advantage when entering and exiting trades.
- Improving input accuracy
Determine the moments of entry and exit from the market. Certain patterns (for example, “head and shoulders” and “flag”) indicate key levels where the price is highly likely to change direction.
- Versatility
Patterns work in different markets (forex, stocks, cryptocurrency) and timeframes. They are suitable for both short-term and long-term trading.
- Easy to use
Unlike complex indicators, many patterns can be easily recognized on the chart, even without special tools.
How does understanding patterns improve your trading strategy?
Using graphical patterns makes your trading strategy structured, logical, and less risky. When combined with other analysis tools and technical indicators and support/resistance levels, understanding patterns increases the accuracy of a trader’s analysis.
This helps traders make more informed trading decisions, minimizing losses and increasing profits.
Definition and main types of patterns
Chart patterns are visual patterns that are formed on the price chart as a result of price movement. They help traders analyze the market situation and roughly understand the future price direction.
Patterns can be divided into three main categories: trending, reversal, and continuation patterns. And then we will analyze each category, as well as their examples.
1. Trend patterns
Trend figures help you determine the current direction of the market and its possible development. They are used to confirm the trend and search for entry points.
Triangles
The triangles show the consolidation period before the impulse move. They can be:
- Symmetrical triangle - signals uncertainty, the breakdown can be either up or down.
- Ascending triangle - suggests an upward breakout and continued growth.
- Descending triangle - most often foreshadows a price drop.
Channels
A channel is a range in which the price moves. There are:
- Ascending channel – the price moves up, forming higher lows and highs.
- Descending channel – the trend is directed down.
- Side channel (flat) – the price fluctuates in a horizontal corridor without a clear trend.
Wedge
The wedge can be either ascending (bearish signal) or descending (bullish signal). Usually, a wedge indicates a slowdown in the current trend and a possible reversal.
2. Reversal patterns
These figures indicate a change in the trend. They are especially important because they allow traders to prepare in advance for a change in market direction.
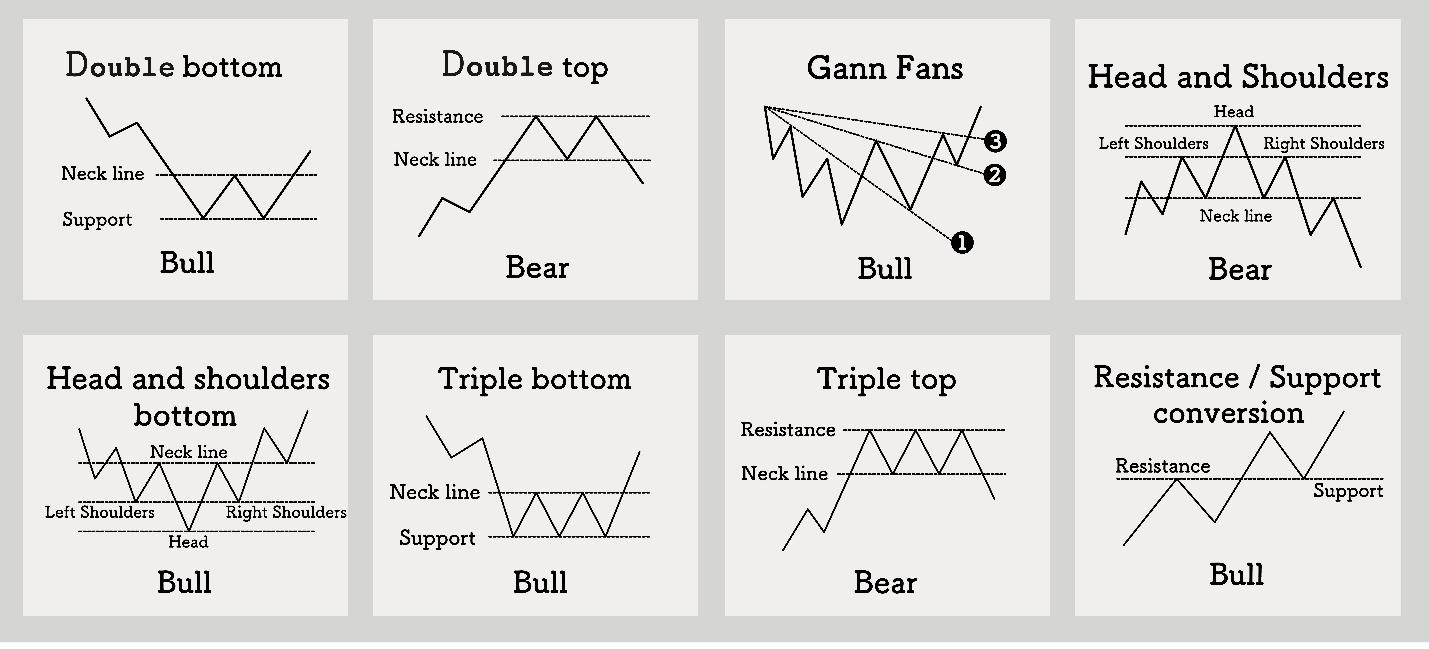
Head and shoulders
One of the most reliable reversal patterns indicates the change from an uptrend to a downtrend.
- It is formed from three vertexes: the central one (head) is higher than the two side vertexes (shoulders).
- A reversal sign is a breakdown of the “neck” line.
- The reverse pattern (“inverted head and shoulders”) portends a change from a downtrend to an uptrend.
Double top and double bottom
- Double top – the price reaches strong resistance twice but cannot break it. This is a signal to fall.
- A double bottom is the opposite pattern, indicating a possible upward reversal.
Wedge (ascending and descending)
- An ascending wedge in an uptrend is a signal of weakening movement and a possible downward reversal.
- A descending wedge in a downtrend is a signal of a possible upward reversal.
When working out reversal patterns, it is important to wait for confirmation of the breakdown of a key level (neck, support, or resistance lines), use indicators (RSI, MACD) and volumes to confirm the signal, and set a stop loss for key levels to minimize risks.
3. Trend continuation Patterns
These models show temporary price stops, after which the trend continues. They help traders identify correction points and find new entry points.
Flag
The flag is formed after a strong impulse movement and represents a small correction. After the figure is completed, the price continues to move in the direction of the main trend.
What it looks like:
- Sharp movement - flagpole.
- A small correction in the form of a parallel channel.
- A breakout in the direction of the trend is a signal to continue the movement.
Vympel
Similar to a flag, but different in that it has the shape of a tapering triangle.
What it looks like:
- A sharp impulse.
- Consolidation in the form of a narrowing figure.
- A breakout in the direction of the trend is a signal to continue the movement.
Rectangle
The pattern is a temporary sideways corridor, after exiting, in which the price continues to move in the direction of the trend.
What it looks like:
- The price moves in a horizontal range.
- The upper limit is the resistance level, and the lower limit is the support level.
- A breakout of one of the boundaries gives a signal for the continuation of the trend.
Chart patterns are a powerful technical analysis tool that allows traders to make more informed decisions. However, they are best used in combination with other methods, such as support and resistance levels, volumes, and indicators.
How to recognize chart patterns
For a trader who uses technical analysis, it is very important to be able to correctly recognize graphic patterns. To effectively identify patterns, it is important to take into account the main features, use technical tools, and understand the significance of the time interval.
In this section, we will analyze:
- Basic features of patterns and tools for their identification.
- The role of the time interval in pattern analysis.
- Real examples of patterns on charts.
Key features and tools for identifying patterns
Main features of patterns
Graphic shapes have a number of common characteristics that help you recognize them:
- The shape of the figure – characteristic outlines (flag, pennant, triangle, head and shoulders, etc.).
- Support and resistance are key levels from which the price bounces or breaks through them.
- Volumes-confirm the strength of the movement: before the breakout of the pattern, volumes often decrease, and at the breakdown, they grow sharply.
- Duration of formation – the longer a pattern is formed, the more reliable it is.
- Trend context - the pattern should be analyzed within the existing trend (uptrend, downtrend, or sideways).
Technical tools for pattern recognition
To better identify chart patterns, traders use additional technical analysis tools:
1. Trend lines
- They help you identify the borders of patterns (for example, the upper and lower borders of a triangle).
- They show the trend directions.
2. Moving Averages (SMA, EMA)
- They allow you to filter market noise and see the overall trend.
- The 50-day and 200-day moving averages are often used to determine a long-term trend.
3. Volume indicators (Volume, OBV)
- Breakouts are confirmed: if the price breaks out of the pattern at a high volume, this is a signal of a high probability of continuing the movement.
Importance of the time interval (timeframe)
Patterns work on different timeframes, but their interpretation depends on the time horizon of trading:
| Timeframe | Description | Application |
| Short-term (5-minute, 15-minute, Hourly charts) | Patterns are formed quickly, but may be less reliable due to market noise. | Suitable for scalping and intraday trading. |
| Medium-term (daily charts) | They give clearer signals because they take more data into account. | They are used for swing trading. |
| Long-term (weekly, monthly charts) | They are formed slowly, but their signals are considered the most reliable. | Suitable for position trading and long-term investments. |
The main rule of working out graphic patterns is that the longer a pattern is formed, the higher the probability of working it out.
Examples of real graphs with an explanation
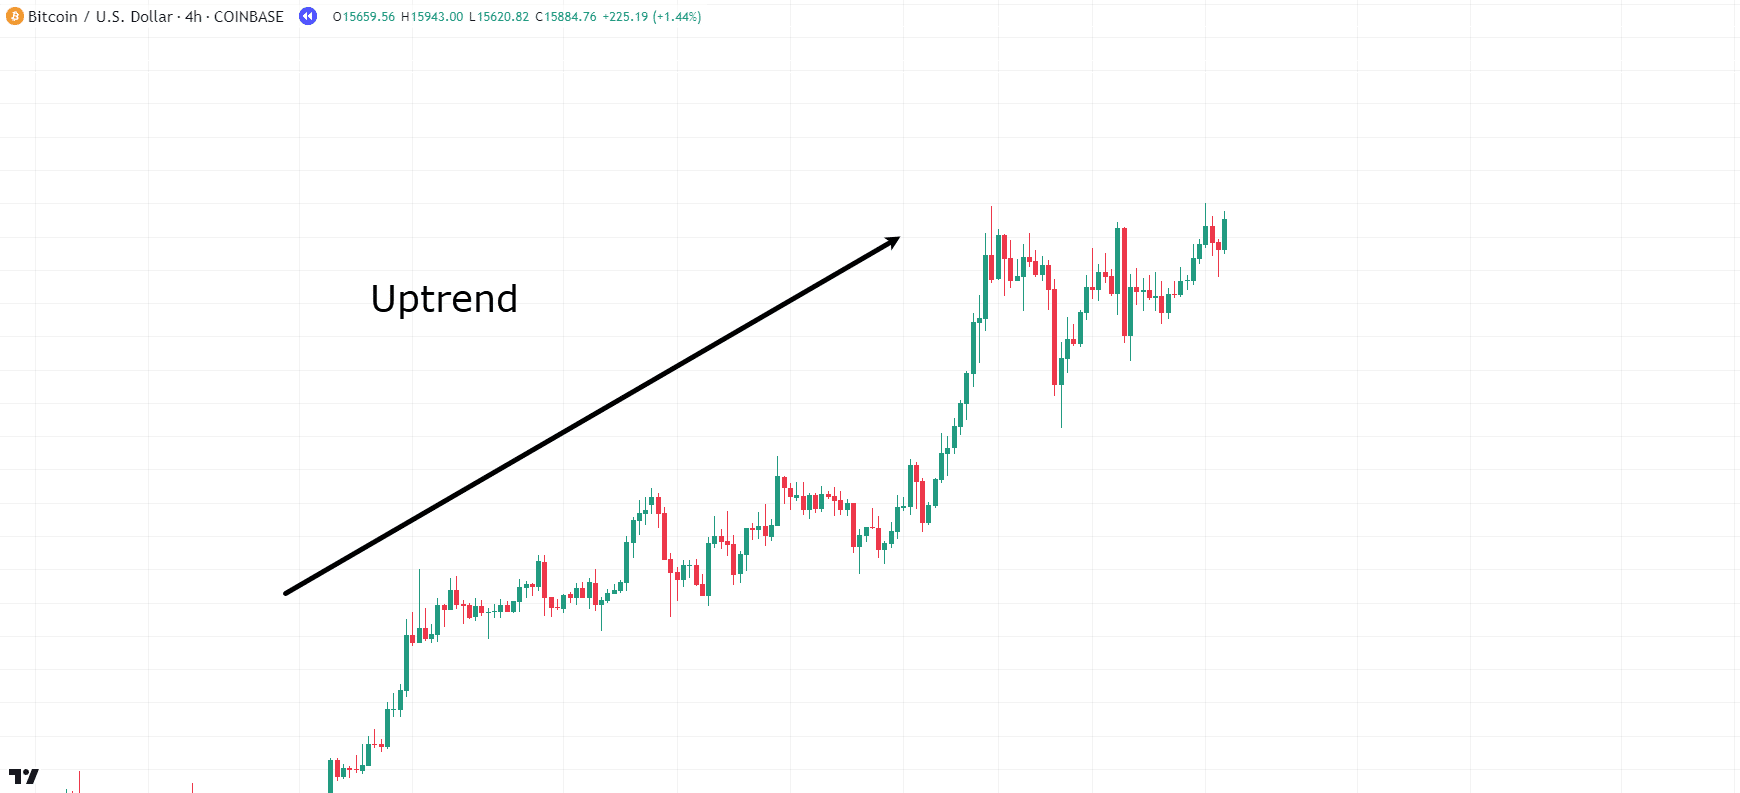
Example 1: Flag in an uptrend
Description:
A flag is a trend continuation pattern that occurs after a strong impulse movement.
What it looks like:
- First, the price makes a sharp upward movement (flag pole).
- Then, the correction begins in the form of a parallel channel directed downwards.
- When the price breaks through the upper limit of the channel, the trend continues.
How to trade:
- Entry: on the breakdown of the upper border of the flag.
- Stop loss: beyond the lower border of the figure.
- Take profit: equal to the length of the flag pole.
Example 2: Head and Shoulders (Reversal pattern)
Description:
This is one of the most reliable reversal patterns that signals a trend change.
What it looks like:
This pattern is formed in three peaks and one line:
- The left shoulder is the first local maximum.
- Head – higher maximum.
- Right shoulder – the third peak, approximately equal to the left shoulder.
- The neckline is the support level that connects the lows between the shoulders.
How to trade:
- Entry: on the breakdown of the neckline down.
- Stop loss: above the right shoulder.
- Take profit: equal to the height of the head.
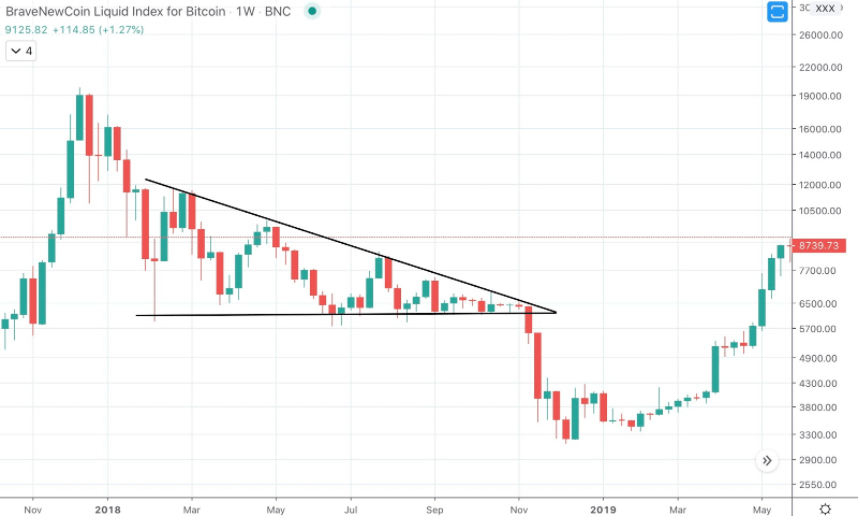
Example 3: Triangle before the breakout
Description:
A triangle is a trend continuation pattern that is formed during a consolidation period.
What it looks like:
- The price contracts in a narrowing range, forming a triangle.
- The highs and lows are gradually converging.
- A breakout of the pattern in the direction of the trend leads to a sharp movement.
How to trade:
- Entry: at the breakdown of the upper (for a bullish trend) or lower (for a bearish trend) border.
- Stop loss: beyond the opposite boundary of the triangle.
- Take profit: equal to the height of the base of the figure.
To effectively use graphical models, a trader needs to:
- Identify key features of the pattern.
- Use technical tools for confirmation.
- Take into account the timeframe in which the figure is formed.
- Wait for a breakdown with confirmation of volumes before entering the trade.
The correct application of this knowledge allows traders to find reliable entry points and increase the effectiveness of their trading strategy.
Practical use of patterns in trading
Chart patterns are a powerful tool that allows traders to predict price movements and find favorable entry and exit points. However, their application requires a clear understanding of the rules, as well as the ability to minimize risks.
In this section, consider:
- How patterns help predict market movements.
- Principles of applying patterns to enter a trade.
- Risks and mistakes to avoid.
How patterns help predict market movements
Patterns are based on repeated patterns of traders ’ behavior and help you determine:
- Trend direction: Whether the trend is up, down, or sideways.
- Reversal points: Reversal patterns show possible reversal points of the current trend based on the level of liquidity and other reasons.
- Trend continuation: Continuation patterns such as triangles, pennants, bullish or bearish, and rectangles.
- The strength and speed of future movement: the size of the figure, depending on the timeframe on which it is formed, as well as the volumes on the coin.
Predicting price movement based on patterns
- Reversal patterns (Head and Shoulders, double top/bottom) signal a likely change in the current trend.
- Continuation patterns (flags, pennants, triangles) indicate temporary consolidation before the trend continues.
- The breakdown of key levels confirms the movement towards a breakdown, especially if it is accompanied by an increase in volume.
Example of forecasting
If the price forms an ascending triangle, the trader can assume that if the upper resistance is broken, the market will continue to grow. If the volume increases at the same time, this is an additional confirmation of the signal.
Principles of applying patterns to enter a trade
To successfully use patterns in your trading, you need to follow several important principles when entering a trade. This will help minimize risks and increase the probability of successful transactions.
1. Pattern confirmation
Before entering a trade, you need to make sure that the pattern is completed and confirmed by other factors. The pattern itself is not a guarantee of success, it is important to wait for its completion and confirmation.
How do I confirm the pattern?
- Level breakdown:
For reversal patterns such as “Head and Shoulders” or “Double Top”, you need to wait for a breakdown of the support or resistance level (for example, the neck line in the “Head and Shoulders” pattern).
- Volume:
The breakdown should be accompanied by an increase in volume, which confirms the strength of the movement. For example, when a resistance level breaks, the volume must be above average for the signal to be reliable.
- Indicators:
The use of technical indicators such as the RSI or MACD can confirm the strength of the signal. For example, the MACD should show a bullish or bearish cross, and the RSI should confirm overbought or oversold conditions.
2. Determining the entry point
After confirming the pattern, you should determine the entry point to the trade. The right entry point is important to minimize risk and maximize profit.
Where to log in?
- On the breakdown:
It is best to enter immediately after the price breaks through a key level, such as a resistance or support level. This may be the starting point of the movement rather than the middle or end of the pattern.
- When rolling back:
Sometimes, a pattern can give a pullback after a breakdown, for example, after the formation of a flag or pennant. In this case, you can enter after the price rolls back to the breakdown level and bounces off it.
- Using a market order:
Open a position at the market price immediately after confirming the pattern if the risk is justified. You can also use pending orders to minimize the delay.
3. Setting a stop loss
A stop loss is a mandatory element of any trading plan. It helps limit possible losses if the market does not go in the direction you expected.
Where to place a stop loss?
- On the opposite side of the pattern:
For example, in the Head and Shoulders pattern, the stop loss is placed slightly above the right shoulder. In the Double Top pattern, the stop loss is placed slightly above the second peak.
- Follow the breakdown level:
In a “Flag” or “Pennant” pattern, you can place a stop loss outside the figure to avoid false breakouts.
- Using volatility:
Depending on the asset’s volatility, you can take into account the standard deviation or ATR to determine the appropriate distance to a stop loss.
It is also important to understand that you need to:
Determine your take profit:
The goal should be clearly defined before entering the trade, so as not to rely on emotions during the trade.
Take into account market conditions:
In addition to the patterns themselves, it is important to take into account current market conditions, such as volatility, news and economic events.
Determine which way to trade:
Depending on the type of pattern, you need to determine whether you want to follow the trend or trade against it.
Applying patterns to enter a trade is not just about finding a pattern on the chart, but a comprehensive approach that includes confirming the signal, setting the correct entry point, and setting stop losses and take profits. It is important not only to take into account the pattern itself, but also market conditions, as well as risk management.
Combining patterns with other analysis methods
The effectiveness of patterns can be significantly improved if combined with other analysis methods. The most popular and frequently used methods are technical indicators, volumes, and trading strategies. Here’s how to combine them.
Combining patterns with technical indicators
Technical indicators can significantly improve the accuracy of signals produced by graphical patterns. When the pattern is confirmed by the corresponding indicator, it increases the probability that the market movement will match the forecast.
Indicators that can be used with patterns:
- RSI (Relative Strength Index):
Use the RSI to confirm overbought or oversold conditions. For example, if the Head and Shoulders pattern indicates a possible downside reversal, and the RSI is in the overbought zone (above 70), this reinforces the sell signal.
- MACD (Moving Average Convergence Divergence):
The MACD helps you track the trend and its strength. If the trend continuation pattern is confirmed by a bullish MACD cross, this indicates a high probability of an upward trend continuation.
- Moving Averages (SMA, EMA):
Using moving averages, you can see the direction of a long-term trend. If the Triangle pattern indicates continuation and the price is above the 200-day EMA, this confirms the uptrend.
- Stochastic Oscillator:
This is an indicator that shows overbought and oversold levels. Use it to confirm reversal patterns. For example, if the “Double Top” pattern indicates a decline, and Stochastic is in the overbought zone, this increases the sell signal.
Confirmation of the referral:
Use indicators to confirm the trend when the pattern is already formed. For example, if the flag pattern signals a continuation of the trend, and the MACD or RSI confirms the strength of the trend, you can safely open a position in the direction of the trend.
Confirmation of a reversal:
If a reversal pattern, such as a “Double Top”, is confirmed by oscillators such as the RSI or Stochastic, this increases the probability that a reversal will actually take place.
The role of volumes in confirming patterns
Volumes are one of the key elements of technical analysis that helps you assess the strength or weakness of a move. They play an important role in confirming chart patterns.
How to use volumes:
- Confirmation of the breakout:
When patterns such as the Triangle or Pennant signal a breakout, it is important that this breakout is accompanied by an increase in volumes. This confirms that the movement is not false, and the market is set to continue the trend.
- Identifying weak breakdowns:
If the breakout is accompanied by low volumes, this may indicate that the movement does not have enough strength to continue, and the signal may be false.
- Volume reduction before the reversal:
In reversal patterns (for example, “Head and Shoulders”), a decrease in volumes at the peak (head) and an increase in volumes on the right shoulder can confirm that the trend is weakening and ready to change.
In the Flag pattern, the price often moves up with increasing volumes, and then, during the flag formation process, the volumes decrease. When the price breaks through the upper limit of the flag, the volume should increase again, confirming the strength of the trend continuation.
Applying patterns to trading strategies
Graphical patterns are often the basis for building trading strategies. When patterns are combined with indicators and volumes, they become an even more powerful tool for making trading decisions.
Strategy using multiple patterns at different time intervals
This strategy is based on using several patterns formed on different timeframes to confirm the signal.
How the strategy works:
- Choosing timeframes:
Start with a higher time interval (for example, daily or weekly) to determine the overall trend. Then, a lower timeframe (such as an hour or 15-minute timeframe) should be used to find a continuation or reversal pattern.
- Entry point:
You should enter a trade if the pattern on a smaller timeframe confirms the movement on a larger timeframe. For example, if a trend continuation pattern appears on the daily chart and a flag pattern also appears on the hourly chart, this is a good entry signal.
- Stop loss and take profit:
Stop loss and take profit can be determined based on the principle of smaller patterns on a smaller timeframe, taking into account the risk at the level of the higher timeframe.
Triangle on the daily chart and flag on the 1-hour chart: The trend on the daily chart is ascending, and a flag is formed on the 1-hour chart, confirming the continuation of the movement. The trader enters the trade after breaking the upper limit of the flag on the hourly chart, taking into account the main trend in the older timeframe.
Combined strategy with volumes and indicators
Patterns become significantly more powerful when used in combination with volumes and technical indicators. This allows you to avoid false signals and improve the accuracy of the input.
How the strategy works:
- Volumes:
Volumes should confirm a breakout or reversal. For example, when the Triangle pattern breaks out, the volume should increase. If the volumes do not confirm the movement, this may be a false breakout signal.
- Indicators:
Using indicators (RSI, MACD, stochastic, etc.) helps to confirm a trend or signal. For example, the MACD can confirm the start of an uptrend when a resistance level breaks, and the RSI can confirm that an asset has not been overbought or oversold.
Flag with volume and MACD: The flag pattern indicates the continuation of the uptrend. When the price breaks through the upper limit of the flag, volumes increase, and the MACD confirms the continuation of the trend, this becomes a buy signal.
The use of graphical patterns in trading strategies allows traders to develop clear rules for entering and exiting the market. A combined approach using volumes and indicators helps to improve the accuracy of trading decisions, reducing the likelihood of errors and increasing the chances of successful trades.
Advantages and disadvantages of using patterns
Advantages:
- Suitable for combining with other analysis methods:
Patterns work well in conjunction with other indicators and analysis methods. This allows you to increase the accuracy of signals, which is especially important for traders who use an integrated approach in their trading.
- Easy to use:
Graphical patterns are quite intuitive and do not require complex calculations, which makes them accessible to most traders, even beginners. Patterns are easily recognized on charts, and their interpretation does not require deep knowledge in technical analysis.
- Increasing the probability of successful trades:
Patterns help traders predict the direction of the market in advance, which increases the likelihood of successful trades. When a pattern is formed on a chart, it serves as a signal based on the historical dynamics of the market.
Disadvantages:
- Exposure to false signals:
One of the main disadvantages of using patterns is the possibility of false signals. Sometimes chart patterns may not meet their forecasts, and the price will continue to move in the opposite direction.
- Confirmation required:
Patterns themselves are not always reliable indicators. To increase the accuracy of the signal, you need to use additional confirmation methods, such as technical indicators (RSI, MACD, volumes, etc.). Without confirmation, the probability of error increases, and the trader can fall into the trap of a false breakdown or other incorrect decisions.
- Take time and experience to apply effectively:
To successfully use patterns, a trader must have the experience and ability to recognize them in various market conditions. Beginners may find it difficult to interpret patterns, which increases the likelihood of mistakes.
Using patterns has its own strengths and weaknesses. They are a convenient tool for predicting market movements and increasing the probability of successful trades, but the trader should be prepared for possible false signals and the need for additional confirmation.
Conclusion
Chart patterns are an important tool in the trader’s arsenal, allowing you to anticipate possible changes in the market and make informed trading decisions. They help you identify both entry and exit points, which helps you improve your trading performance.
However, like any other method of analysis, patterns require attention and confirmation using other tools to avoid false signals and errors. By mastering the recognition and interpretation of chart patterns, a trader can significantly improve their strategy and increase the probability of successful trades.