What are RSI and MACD Indicators and How to Use Them?
Contents
- Introduction
- Relative Strength Index (RSI) Indicator
- MACD (Moving Average Convergence Divergence) Indicator
- RSI and MACD comparison
- How to combine RSI and MACD in trading
- Conclusion
Introduction
Technical analysis is a method of evaluating financial markets based on the analysis of market data, such as prices and trading volumes. Traders and investors use technical analysis to determine price movements, identify trends, and find potential entry and exit points in the Market. An important part of this analysis is the various indicators that help you interpret market data and make better informed decisions.
Why do traders need indicators?
Indicators serve traders to improve their strategy and simplify market analysis. They provide information about the current state of the Market, such as trend strength, overbought or oversold levels, and can also signal possible changes in price direction. Using indicators helps to reduce the risks of incorrect analysis and increase the probability of successful trades.
RSI and MACD indicators
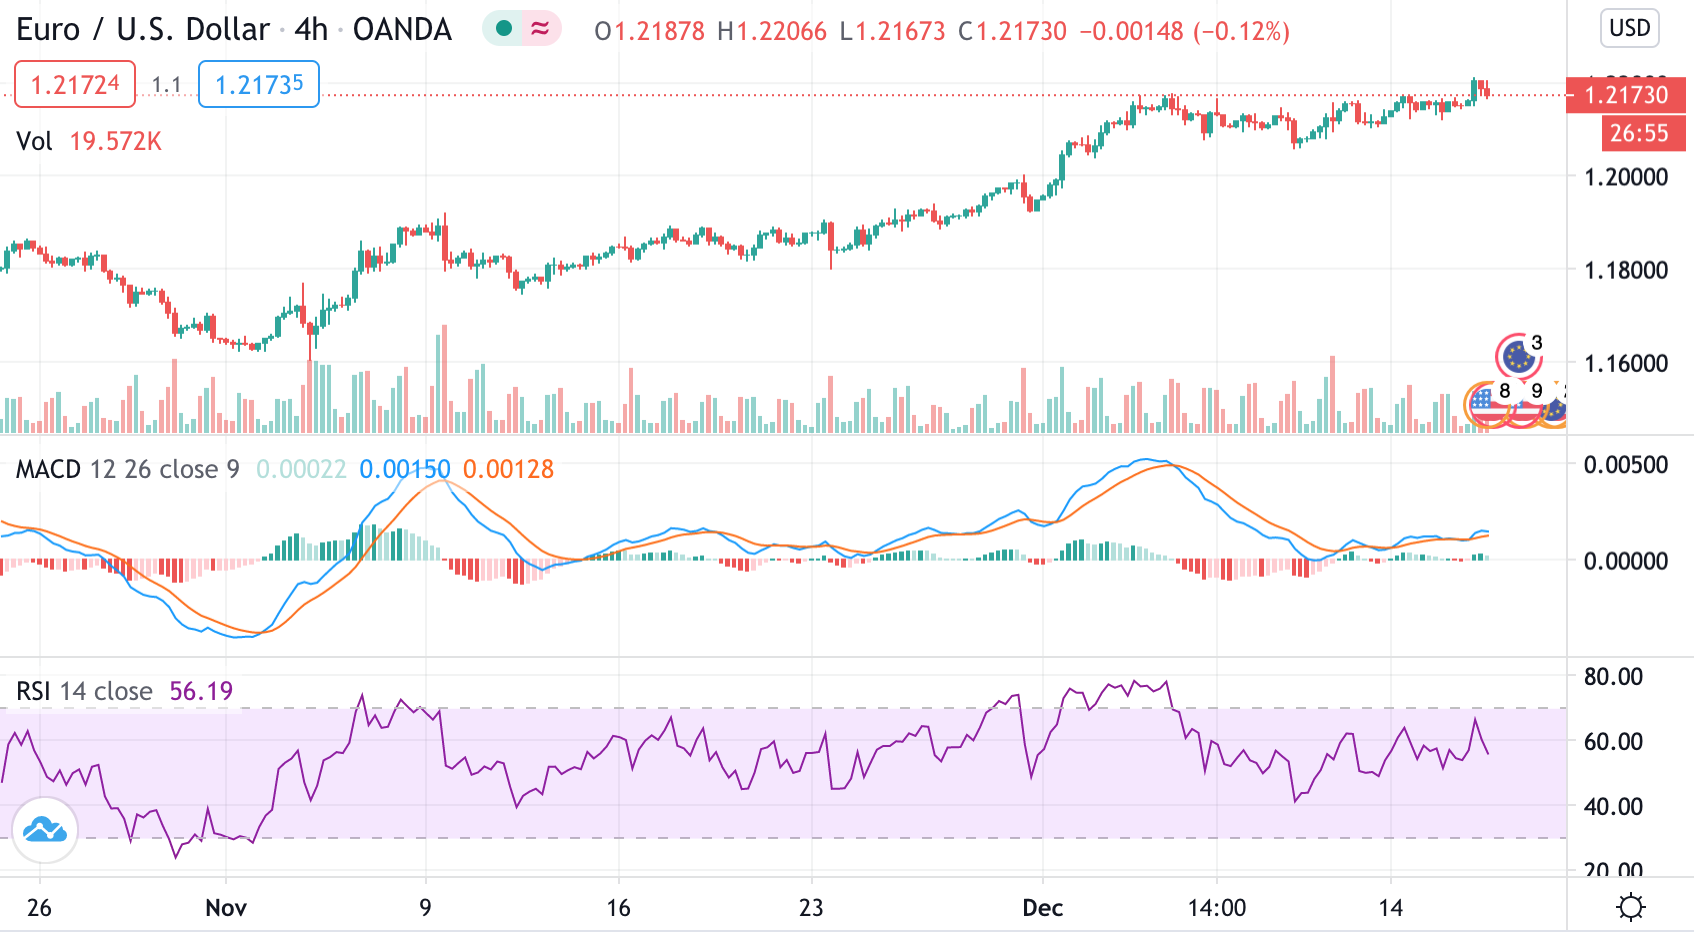
RSI (Relative Strength Index) — Relative Strength Index. This indicator helps determine whether an asset is overbought or oversold, which can signal a possible trend reversal. The RSI measures the speed and change of price movements, ranging from 0 to 100. A value above 70 indicates overbought conditions, while a value below 30 indicates oversold conditions.
MACD (Moving Average Convergence Divergence) — Indicator of convergence/divergence of moving averages. The MACD helps you determine the strength, direction, and duration of a trend, as well as possible reversal points. It is based on the difference between two exponential moving averages (fast and slow) and also includes a signal line that helps confirm signals about possible trend changes.
Both of these indicators are actively used by traders to make decisions based on the analysis of market conditions. Combining classic technical analysis with factors from indicators, traders usually make decisions on entering and exiting a trade.
Relative Strength Index (RSI) Indicator
What is the RSI: definition and principle of operation
The RSI (Relative Strength Index) is an indicator that measures the speed and changes of an asset’s price movements. It helps traders determine whether an asset is overbought or oversold, which can signal possible trend reversals. The indicator ranges from 0 to 100 and is used to assess the strength of the current trend, as well as to find reversal points.
How the RSI is calculated: formula and parameters
The RSI is calculated based on average price changes over a certain period (usually 14 days). The formula looks like this:

Where:
- RS (Relative Strength — is the ratio of the average profit for a given period to the average loss for the same period.
- The average profit and average loss are calculated for the previous 14 days or other periods, depending on the settings.
To calculate RS, you need to calculate the average profit: if the price has increased compared to the previous period
And average loss: if the price has fallen
After the average gains and losses are calculated, their ratio is calculated = - RS.
The resulting value is substituted into the main formula for calculating the RSI.
Parameters:
14 days is the standard period used for calculating the RSI, but it can be adjusted depending on the trader’s preferences.
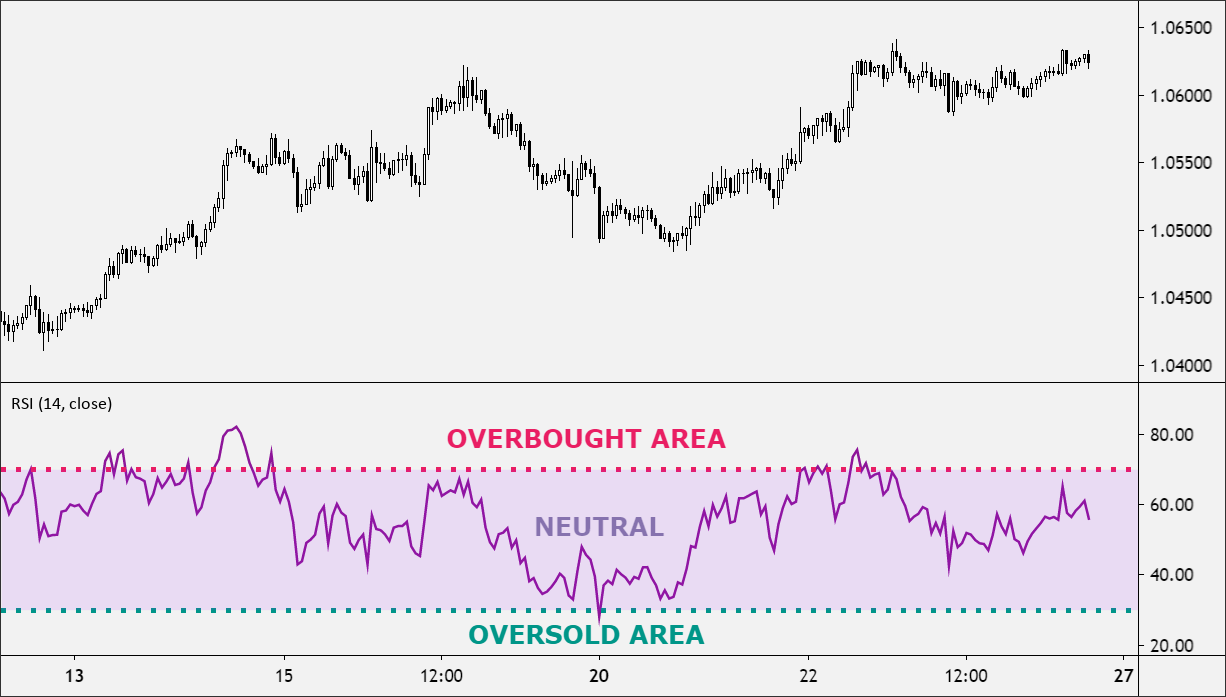
How to read the RSI chart: values 30, 50, 70
- RSI 70 (Overbought):
When the RSI value exceeds 70, this may indicate that the asset is overheated, and a trend reversal or downward correction is possible. This level indicates a high probability that the Market has become too optimistic.
- RSI 30 (oversold):
A value below 30 indicates that the asset is oversold, which may be a sign that the price has fallen too much, and an upward reversal is possible. This signals a strong bearish trend, but can also indicate a possible end to that trend.
- RSI around 50:
A value of around 50 indicates a neutral market condition. This does not give a clear signal of overbought or oversold conditions and may indicate that the Market is in consolidation.
To effectively read the RSI chart, it is important to take into account not only the levels themselves, but also the context of the current market trend, as well as other indicators for more accurate forecasts.
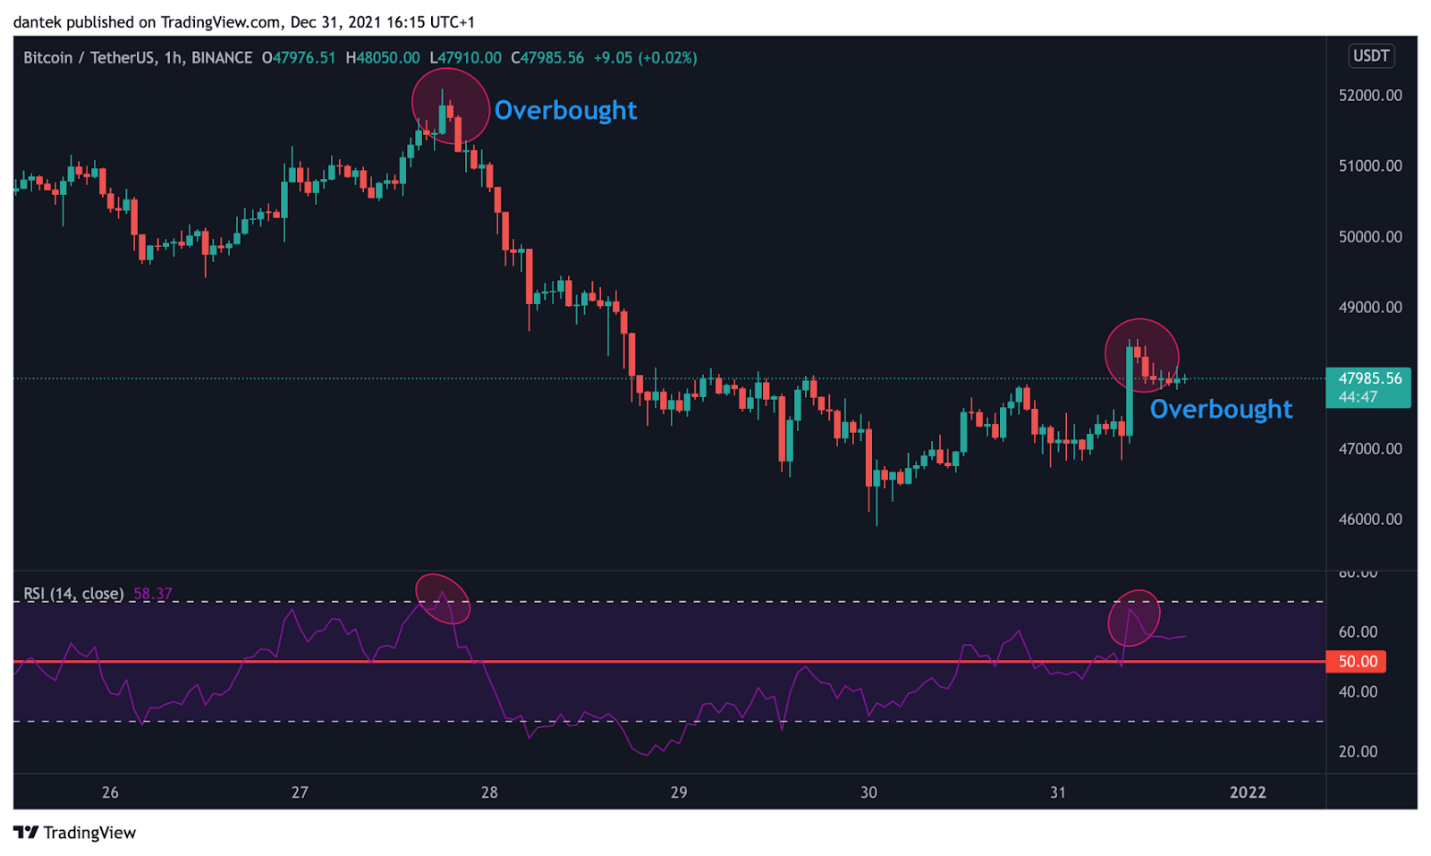
RSI Signals: Overbought, Oversold, Divergence
Overbought: When the RSI is above 70, it signals that the Market is overbought. Traders may view this signal as a possible selling point, suggesting that the asset price may decline.
Oversold: When the RSI is below 30, it signals oversold conditions, which can be a reason to buy, expecting the price of the asset to rise.
Divergence: A divergence occurs when the direction of price action diverges from the direction of the RSI. For example:
- Bullish divergence: When the price continues to decline and the RSI starts to rise. This may indicate an upward reversal.
- Bearish divergence: When the price continues to rise and the RSI starts to decline. In this case, it may signal a downward reversal.
Divergence is a stronger signal, but it requires care, as sometimes divergence can occur in the middle of a trend and does not always lead to a reversal.
Use of RSI signals in trading:
For short-term traders, overbought and oversold signals can be used to enter and exit trades in order to profit on corrections.
Buy when oversold (RSI < 30): When the RSI falls below 30, this can be a signal that the asset is oversold.
Sell when Overbought (RSI > 70): When the RSI is above 70, it may mean that the asset is overbought, and traders may be looking for opportunities to sell or exit the position.
For long-term investors, divergence signals can serve to identify trend reversal points, which can be useful for larger positions.
Using Divergence: Paying attention to divergences can help identify possible market reversals. For example, if the price continues to rise but the RSI starts to decline, this may be a sell signal.
The RSI indicator is a powerful tool for market analysis, but it can give false signals in the face of strong trends. Therefore, it is recommended to use it together with other analysis methods and indicators to improve the reliability of trading decisions.
The RSI is often used in combination with other indicators, such as the MACD or moving averages, to confirm signals and improve the accuracy of analysis and signals.
MACD (Moving Average Convergence Divergence) Indicator
What is the MACD: definition and principle of operation
The MACD is an indicator that helps you determine the strength, direction, and duration of a trend and possible reversal points. It is based on the difference between two exponential moving averages (EMAS): a shorter one and a longer one. This indicator is widely used by traders to assess the trend and search for buy or sell signals.
How the MACD works:
When the fast EMA (shorter) crosses the slow EMA (longer) from the bottom up, it signals the possible start of an uptrend.
When the fast EMA crosses the slow EMA from top to bottom, it may indicate a possible start of a downtrend.
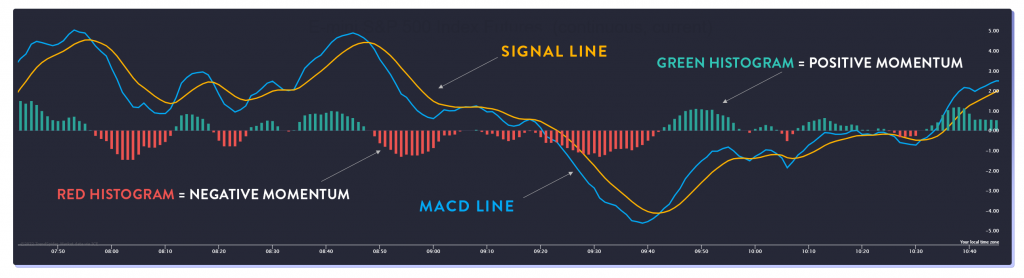
How the MACD is calculated: MACD lines, signal line, histogram:
The MACD indicator is based on the difference between two exponential moving averages (EMAS), as well as an additional smoothing line and histogram.
1. The MACD line (Main Line)
The MACD is based on the difference between two exponential moving averages (EMAS):
- Short (fast) EMA — most often with a period of 12
- Long (slow) EMA — usually with a period of 26
The MACD is calculated as the difference between them:
MACD= EMA (12) – EMA (26)
Where:
- EMA (12) - exponential moving average with a period of 12 (short).
- EMA (26) - exponential moving average with a period of 26 (long).
The larger the difference between the EMA (12) and the EMA (26), the higher or lower the MACD line is.
Thus, the MACD indicator shows the degree of divergence or convergence of two averages, which helps to determine the strength of the trend and its direction.
2. Signal line
The signal line is the EMA from the MACD line (usually with a period of 9). It smooths out the MACD readings and helps you identify buy or sell signals:
Signal Line = EMA (9) from the MACD line
When the MACD line crosses the signal line, it is one of the key trading signals.
3. The MACD Histogram
The histogram shows the difference between the MACD line and the signal line. It helps you visually determine the strength of the trend:
Histogram = MACD-Signal Line
- If the histogram is positive (the MACD is above the signal line), this indicates a bullish trend.
- If the histogram is negative (the MACD is below the signal line), this indicates a bearish trend.
- The higher the histogram, the stronger the trend. The lower, the weaker.
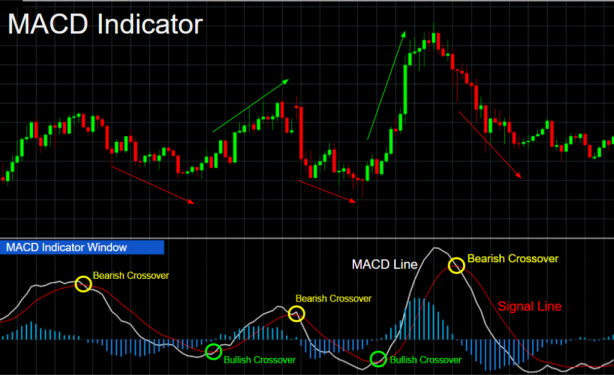
MACD Signals: Line Intersections, divergence, Histogram
1. Line intersections (the main trading strategy of the MACD)
Intersections of the MACD line and the signal line are the main signals for opening positions.
- Bullish intersection:
When the MACD line crosses the signal line from the bottom up. In a bullish cross, traders can see this as a buy signal, opening long positions, expecting an uptrend.
- Bearish cross:
When the MACD line crosses the signal line from top to bottom in a bearish cross, traders can use this as a signal to sell or open a short position, suggesting a downtrend reversal.
These intersections help traders determine when to enter the Market as soon as the trend begins to change direction.
2. Divergence
A divergence between the asset price and the MACD indicator may signal a possible trend reversal. It is important to look for divergence on strong trends, as it often predicts changes.
Bullish divergence:
If the price of an asset continues to decline and the MACD starts to rise (or its histogram increases), this may be a sign that the downtrend is weakening, and an upward reversal may occur.
For example: the price creates new lows, but the MACD shows an increase (or smaller lows), which indicates a possible trend change.
Bearish divergence:
When the price continues to rise, and the MACD starts to decline (or its histogram decreases), this may indicate a weakening of the uptrend and a possible downward reversal.
For example: the price creates new highs, but the MACD shows a decline (or smaller highs), which can be a harbinger of a fall.
3. The MACD histogram:
The histogram shows the difference between the MACD line and the signal line. When the histogram increases, it means that the difference between these lines is growing, which may indicate an increasing trend.
Increasing the histogram
- When the histogram increases in the direction of positive values, this indicates a strengthening of the bullish trend.
- When the histogram increases towards negative values, this indicates a strengthening of the bearish trend.
Decreasing histogram:
- When the histogram starts to decrease (narrow), it can mean that the trend is weakening. In the case of a bullish trend, this can be a signal of a possible downward reversal, and in the case of a bearish one, it can be a signal of an upward reversal.
The histogram crosses the zero Line:
Crossing the zero line histogram is also an important signal:
- A positive cross indicates the beginning of an uptrend (buy).
- A negative cross indicates the beginning of a downtrend (sell).
Ultimately, the intersections of the MACD and the signal line give the main signal of a trend change. The divergence between the price and the MACD often predicts a reversal of the current trend. A histogram helps you assess the strength of the trend and its duration, as well as identify possible points for opening positions or exiting.
Using the MACD in trading: how to use it in practice
1. Intersections of the MACD lines:
In a bullish cross, traders can see this as a buy signal, opening long positions, expecting an uptrend.
In a bearish cross, traders can use this as a signal to sell or open a short position, suggesting a downtrend reversal.
2. Divergence:
If the divergence is confirmed by other indicators or analytical tools, it can be a strong buy or sell signal. For example, a bullish divergence with the RSI or other indicator can increase confidence that the trend will soon turn up.
Bearish divergence, in combination with other indicators, can serve as a reliable signal to exit long positions or open short ones.
3. The MACD histogram:
When the histogram rises, it can indicate a stronger trend, and traders can stay in positions or strengthen their positions.
When the histogram contracts, it can be a signal for traders about a possible weakening of the trend or a harbinger of a correction, which can lead to an exit from the position or closing the trade.
4. Trade using several indicators:
Many traders use the MACD in combination with other indicators such as the RSI, moving averages, or support and resistance levels to get more reliable signals. For example, if the MACD gives a buy signal and the RSI confirms that it is not overbought, this can be a strong signal to enter the Market.
The MACD is a powerful tool for determining a trend, assessing its strength, and identifying possible reversal points. The main signals include the intersection of the MACD lines, divergence, and histogram. However, as with any other indicator, it is important to use the MACD in combination with other analysis methods and take into account the market context for more accurate and informed trading decisions.
RSI and MACD comparison
The RSI (Relative Strength Index) and MACD (Moving Average Convergence Divergence) indicators are popular technical analysis tools, but they work differently and serve different purposes. Let’s look at their main differences, and also consider when it is best to use each indicator.
| Parameter | The Relative Strength Index (RSI)parameter | MACD (Convergence and Divergence of moving averages) |
| Indicator type | Oscillator | Trend indicator |
| Main goal | Determines overbought and oversold | levels Shows the strength of the trend and its possible reversal |
| Calculation method | is based on comparing the value of recent gains and losses | Based on the difference between two EMAS (12 and 26) |
| Value range | From 0 to 100 (key levels 30 and 70) | Values change negative and positive without a fixed range |
| Main signals | Levels 30 and 70, divergence | MACD and signal line intersection, zero line intersection, divergence |
| Best environment for working | Flat market (sideways movement) | Trending Market |
| Sensitivity | Can give false signals during strong trends | Works better in trending movements |
When to use the RSI and MACD?
Both indicators are useful in different market situations. The choice between RSI and MACD depends on what type of movement prevails in the Market: flat (sideways) or trend.
The RSI is best used when the Market is flat (moving sideways).
- It helps you determine when an asset becomes overbought (more than 70) or oversold (less than 30).
- It is well suited for finding reversals at local highs and lows.
For example, if the RSI is overbought (above 70), a downside correction can be expected. If the RSI is below 30 – an upside rebound is likely.
The MACD is more effective in trending markets.
The MACD shows the strength of the trend and possible reversals based on the divergence of moving averages.
- It helps to determine the strength of the trend and possible moments of its change.
- Shows divergence between price and trend, signaling reversals.
Example: If the MACD crosses the signal line from the bottom up, this confirms the uptrend, and you can consider buying.
Many traders use both indicators together to filter out false signals. For example, if the RSI shows an overbought position and the MACD confirms a bearish reversal, this is a strong sell signal.
Advantages and disadvantages of RSI and MACD
Let’s compare the advantages and disadvantages of RSI and MACD in the table below:
| Indicator | Advantages | and Disadvantages |
| of the RSI indicator | -Works well in a sideways market. \ - Easy to use. \ - Suitable for finding U-turns. | - May give false signals during strong trends. \ "Sometimes it's late. |
| MACD | - Effective in trending movements. \ - Confirms the trend direction. \ - Allows you to evaluate the strength of the trend. | - Delays due to the use of moving averages. \ - Does not give clear signals when flat. |
Thus, the RSI is suitable for short-term trades in a narrow range, while the MACD is suitable for working with trends and longer-term movements.
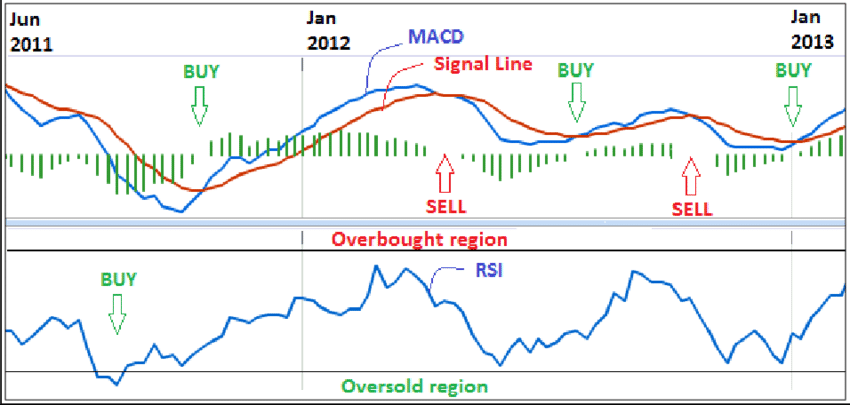
How to combine RSI and MACD in trading
Using the RSI and MACD together allows traders to get more accurate signals, filter out false entries, and confirm the direction of the trend. Next, we will analyze the advantages, strategies, and mistakes that should be avoided when combining them.
Advantages of using the RSI and MACD simultaneously
The main advantages of the combination of RSI and MACD
Filtering out false signals
- The RSI may show overbought (70) or oversold (30), but this does not always mean a reversal.
- The MACD helps confirm or deny the signal, showing the strength of the trend.
Sharing in different market conditions
- The RSI works better when flat, helping you find pivot points.
- The MACD is effective in trends, indicating a continuation or deceleration of the movement.
Confirming each other’s signals
- When the RSI and MACD give the same signal, the probability of a successful trade increases.
- For example, if the RSI is oversold (30) and the MACD is forming a bullish crossover, this is a strong buy signal.
High-precision divergence detection
- RSI divergence shows a slowing trend but does not always lead to a reversal.
- The MACD divergence further confirms the weakness of the trend and the approach of a reversal.
Examples of successful strategies with RSI and MACD
Strategy 1: Trend Trading with the MACD and RSI
In this strategy, the MACD determines the main trend, and the RSI helps you find entry and exit points. We enter the Market in the direction of the trend when both indicators confirm the signal.
Long if the following conditions apply:
- MACD: The MACD line crosses the signal line from bottom to top (bullish crossover).
- RSI: Rises above 50 but below 70 (confirms the strength of the trend).
- The MACD histogram starts to grow, which indicates a strengthening trend.
Exit from the transaction:
- The RSI reaches 70 and above – partial profit taking is possible.
- The MACD crosses the signal line down – a complete exit from the trade.
Example:
The RSI is above 50, and the MACD is forming a bullish crossover - a buy signal.
RSI reaches 70, MACD weakens – profit taking.
Short under the following conditions:
- MACD: The MACD line crosses the signal line from top to bottom (bearish crossover).
- RSI: Falls below 50, but above 30 (confirms a downtrend).
- The MACD histogram is decreasing, which indicates the weakness of the movement.
Exit from the transaction:
- RSI is approaching 30 – partial profit taking is possible.
- The MACD crosses the signal line up – a complete exit from the trade.
Example:
The RSI is below 50, and the MACD is forming a bearish crossover - a sell signal.
The RSI is approaching 30, the MACD is weakening – profit taking.
Strategy 2: Countertrend Divergence Trading
Countertrend divergence trading with the MACD and RSI allows you to find trend reversals before they are confirmed, providing favorable entry points. However, it is necessary to confirm the signals with additional factors, such as volumes and support / resistance levels, in order to reduce the probability of false entries.
Conditions of entry to sell (short) at the top of the trend
- The price is forming a new high, but the MACD and RSI are showing lower highs – divergence.
- The RSI is above 70 but starting to decline - indicating a weakening of the uptrend.
- The MACD crosses the signal line down and confirms the reversal.
- Additional confirmation is a decrease in volumes or a breakdown of local support levels.
Exit from the transaction:
- The RSI is approaching 50 – you can partially fix the profit.
- The MACD crosses the signal line up – a complete exit from the trade.
Example:
The price is forming a new high, but the RSI and MACD are showing divergence - a reversal signal.
The MACD crosses the signal line down, the RSI falls below 70-sell.
Buy entry conditions (long) at the bottom of the Market
- The price is forming a new low, but the MACD and RSI have already reached a higher low – a divergence.
- The RSI is below 30 but is starting to indicate a weakening of the downtrend.
- The MACD crosses the signal line up and confirms the reversal.
- Additional confirmation is an increase in volumes or a breakdown of local resistance levels.
Exit from the transaction:
- The RSI is approaching 50-60 – you can partially fix the profit.
- MACD weakens – complete exit from the trade.
Example:
The price is falling, but the RSI and MACD are showing divergence - a reversal signal.
The MACD crosses the signal line up, the RSI rises above 30-buy.
Divergence shows a weakening trend, which makes it possible to enter a trade before it reverses.
The MACD confirms a change in the direction of movement, and the RSI helps to determine the level of overbought or oversold conditions.
Using multiple confirmation signals reduces the chance of false inputs.
How to avoid errors when combining indicators
1. Ignoring the market context
Error: Using indicators without taking into account the trend or flat.
Solution: Use indicators mainly in the trend and add other tools for flat trading.
2. Schedule congestion
Error: Using too many indicators.
Solution: Limit yourself to the RSI, MACD, and support/resistance levels.
3. Small timeframes
Error: Using indicators in timeframes that are too short.
Solution: Work on timeframes from 1 hour and above.
4. No stop losses
Error: Ignoring stop losses.
Solution: Set your stops at local lows/highs and follow money management.
5. Trading against a strong trend
Mistake: Counteracting the trend in its strong phase.
Solution: Trade in the direction of the trend, using the RSI and MACD for confirmation.
An effective combination of RSI and MACD requires taking into account the context, confirming signals and competent risk management. The main principles: do not trade in chaos, use additional factors and do not ignore the trend.
Conclusion
The RSI and MACD indicators are powerful technical analysis tools that help traders make informed market decisions. The RSI helps to identify overbought and oversold conditions, while the MACD signals the strength of the trend and possible reversals. It is important to understand that each indicator has its own characteristics and works best in combination with other tools.
When combining the RSI and MACD, traders can more accurately determine the entry and exit points, minimizing risks. However, for successful trading, it is necessary to take into account the market context, set stop losses, and monitor the correct interpretation of signals. Using these indicators together with proper money management and additional filters can significantly improve the effectiveness of trading strategies.