What is statistics range?
Hi!
Our platform has a feature to set the range of statistics displayed, which many people are surprisingly unaware of.
We’ve created a short video about this feature, and we strongly recommend you to check it out.
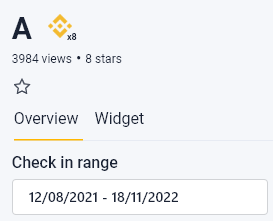
Each portfolio has a time range, which by default is equal to the first and last trade on the portfolio, but you can always change it by clicking on the field under “Check in range”. The popup allows you to select the exact time interval you want.
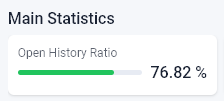
All сharts and key stats will change and show everything that occurred within the selected range.As you may notice, OHR is also changed. OHR – stands for open history ratio. It is a stat, that represents what percent of all historical data is currently displayed on graphs and used in key stats calculation, out of all historical data available on API key linked to the portfolio
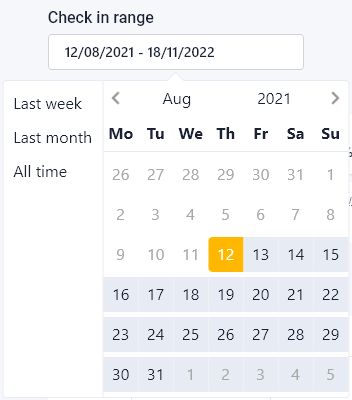
You may select either a single day by clicking on the same date twice, or any time range by picking up two dates.In addition, this menu has shortcuts.
For example:
“Last Week” displays the stats for the last 7 days.
“Last Month” displays stats for the last 30 days.
And so “All Time”, correspondingly selects the entire available time range at once.
This was a short guide for how to check portfolio stats in selected range, Thanks for reading