Trading Basics: Accumulation vs Distribution
Contents
- Introduction
- What Are Accumulation and Distribution
- Key Signs of the Accumulation Phase
- Key Signs of the Distribution Phase
- Analytical Tools
- Market Structure: Support and Resistance Levels
- Chart Examples
- Common Mistakes in Identifying Phases
- Conclusion
Introduction
At first glance, price movement may seem chaotic. However, it often follows patterns typical of financial markets. One such pattern is alternating phases, such as accumulation and distribution. These stages, outlined in Wyckoff theory, reflect the actions of major players: they are either building or exiting positions. Understanding the current market phase allows a trader to make more informed decisions, avoid weak entries, and identify potentially profitable trade setups.
A trader who can distinguish accumulation from distribution gains a real edge. They know when it’s time to start building a position alongside smart money—and when it’s better to exit and wait for a correction.
What Are Accumulation and Distribution
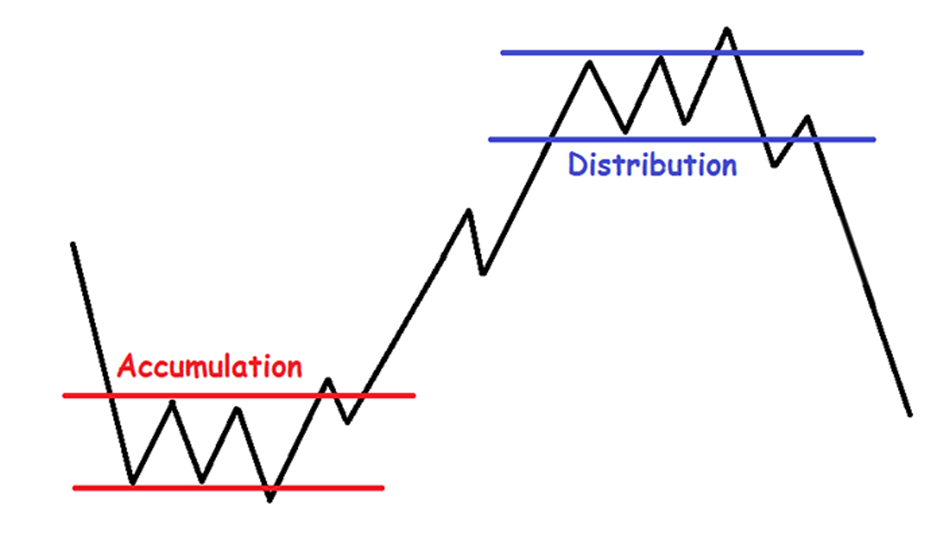
Accumulation
The accumulation phase often appears as a sideways movement following a prolonged downtrend. Price fluctuates within a narrow range, and it may seem like nothing is happening at first glance. However, a closer look at volume tells a different story.
While sideways markets typically show lower activity, volume often spikes at the breakout points—signals that large players are absorbing liquidity. These participants aim to quietly accumulate positions without triggering an early price surge.
Retail traders usually lose interest in such zones, dismissing the asset as “dead,” while institutional players make their moves behind the scenes.
Distribution
Distribution is the reverse process. After a substantial price increase, major players began to sell their holdings gradually. Selling everything at once would cause a market crash, so they created the illusion that the uptrend continued. This attracted many novice traders hoping for further gains. Large holders exploited this optimism to exit their positions smoothly.
Distribution also occurs within a sideways range, typically slightly above previous peaks. Volumes often increase, with sudden upward spikes that can be misleading. Traders may believe the market is poised for another rally, but smart money is already exiting.
Psychology During These Phases
-
During accumulation, the market appears sluggish. Traders hesitate to buy, fearing further declines and doubting a reversal. This creates ideal conditions for large-scale accumulation.
-
Euphoria peaks during distribution. The news is overwhelmingly positive, and traders fear missing out and entering high positions. Meanwhile, informed participants are selling to those arriving late.
Key Signs of the Accumulation Phase
Sideways Movement After a Decline
Following a significant drop, the price often ceases to trend and begins moving sideways within a narrow range, resembling a calm after the storm. Such consolidation may not attract much attention, but it’s when major players re-enter the market, accumulating positions slowly to purchase at lower prices and in large volumes.
Increasing Volume on Upward Moves, Decreasing on Pullbacks
Volume analysis during accumulation reveals control dynamics. When the price rises, volumes increase, indicating active buying. Conversely, during pullbacks, volumes decrease, suggesting a lack of selling pressure. This pattern indicates demand is starting to outweigh supply, signalling a potential upward reversal.
Low Volatility and Absence of a Trend
At this stage, price movements are slow and reluctant, with no significant spikes. The chart appears “dormant,” leading many traders to exit the market, believing nothing is happening. Critical processes are underway, as major players prepare for the next trend while the crowd awaits movement.
Formation of a Support Level
During accumulation, the price repeatedly approaches a specific level from below but fails to break it. Each dip attracts buyers, establishing a clear support level. The more times this level is tested, the stronger it becomes. Once the price breaks above the accumulation range’s upper boundary, a rally often ensues, marking the start of a new bullish trend.
Key Signs of the Distribution Phase
Sideways Movement After a Rally
After a rapid ascent, the price halts upward and begins moving sideways. This resembles accumulation but occurs at the chart’s top. The market neither falls nor rises significantly, entering a state of inertia. During this period, major players start exiting the market, selling their positions while buyers remain plentiful.
Increasing Volume on Downward Moves, Decreasing on Pullbacks
Volume analysis indicates strengthening sellers. When the price declines, volumes rise, signifying active selling. During upward pullbacks, volumes decrease, indicating weakening demand. These signs suggest increasing downward pressure, potentially marking the beginning of a downward reversal.
Choppy Movements Without a Clear Trend
In the distribution phase, price movements become erratic, with frequent sharp jumps up and down that can be confusing. These movements don’t lead to sustained growth and are often called “whipsaws.” Many traders fall into traps during this period, buying on spikes and incurring losses when prices drop suddenly. Major players use this illusion of activity to exit positions smoothly.
Breaking Support with Increased Volume
When sellers gain complete control, the price breaks below the range’s lower boundary, accompanied by a sharp increase in volume. This indicates a mass exit of participants. Following such a breakdown, a significant decline typically follows. Those who didn’t exit earlier are left in losing positions, highlighting the importance of recognizing distribution phases and exiting before substantial decreases begin.
Analytical Tools
Volume Indicators
Volume helps assess market activity, but interpreting it requires context. Volume can behave differently during the accumulation and distribution phases—its increase doesn’t always imply a corresponding price move.
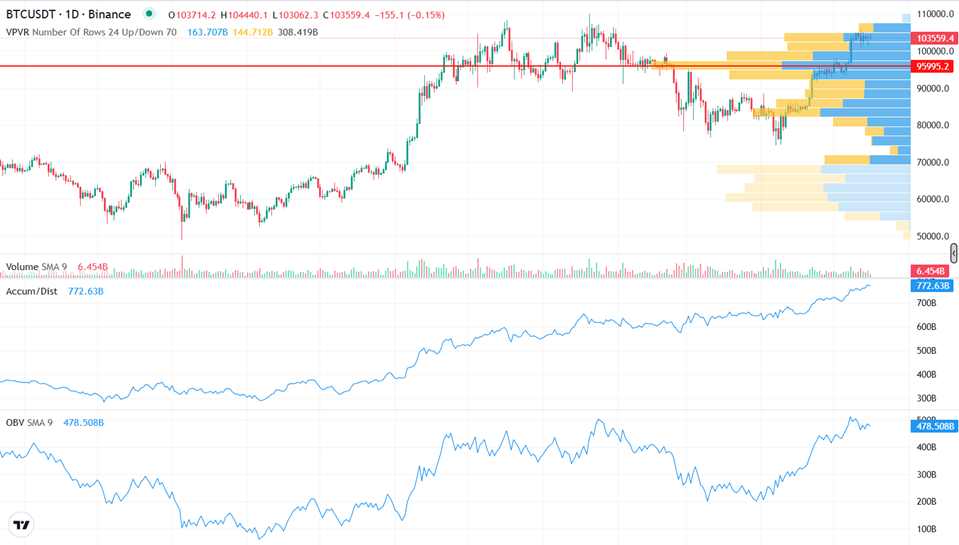
For example, the Volume Profile highlights where price has spent the most time, revealing zones of high liquidity. However, it reflects horizontal volume, which is more indicative of trading density than direction.
Indicators like OBV (On-Balance Volume) or the Accumulation/Distribution Line aim to link volume to price movement. They can hint at hidden accumulation or distribution occurring beneath a calm surface. Still, these signals shouldn’t be interpreted in isolation from the broader market context.
Volume is just one piece of the puzzle—it starts to form a clearer picture only when combined with price action, candlestick structure, and the overall market phase.
Market Structure: Support and Resistance Levels
Prices often react to specific levels. Support is a zone where prices resist falling further, while resistance is a level from which prices frequently decline.
During accumulation, prices stay above support. In distribution, they remain below resistance. A price breaking through these levels with high volume may signal the start of a strong movement.
Price Behavior Near Key Levels
Observing price action near significant levels is crucial. If high volume appears near support without a price drop, it may indicate buying interest. Conversely, high volume near resistance without price increases may suggest significant selling.
Sharp candle shadows, frequent rebounds, and narrow ranges indicate a battle between buyers and sellers. These moments are critical for understanding market intentions.
Chart Examples
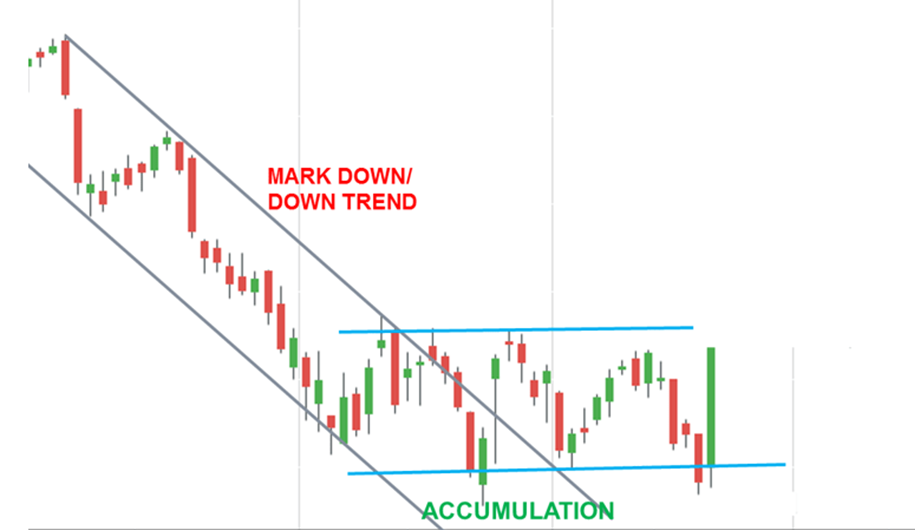
Accumulation Phase: Chart Example
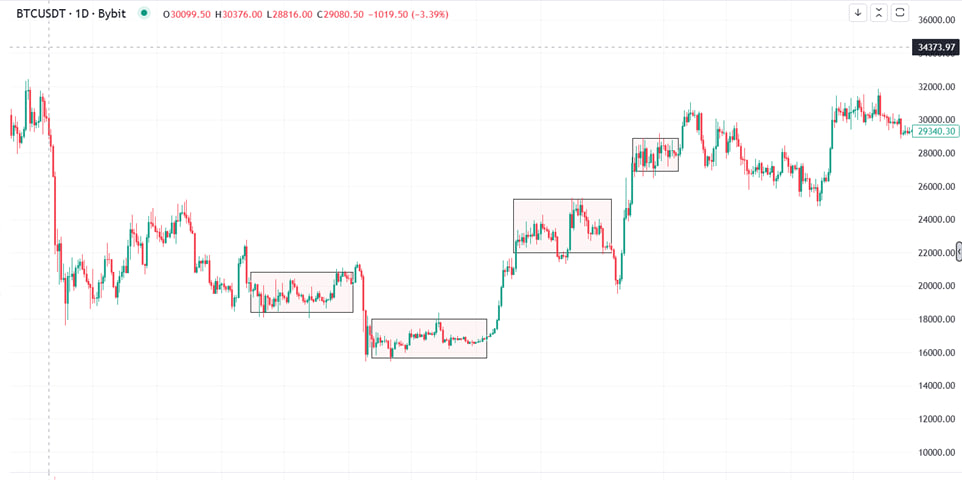
After a significant decline, Bitcoin’s price began moving within a narrow range. Despite the sideways movement, volumes increased during upward moves and decreased during pullbacks, resembling an accumulation phase. A confident rally ensued once the price broke above the range, confirming the market had completed the accumulation stage.
Distribution Phase: Chart Example
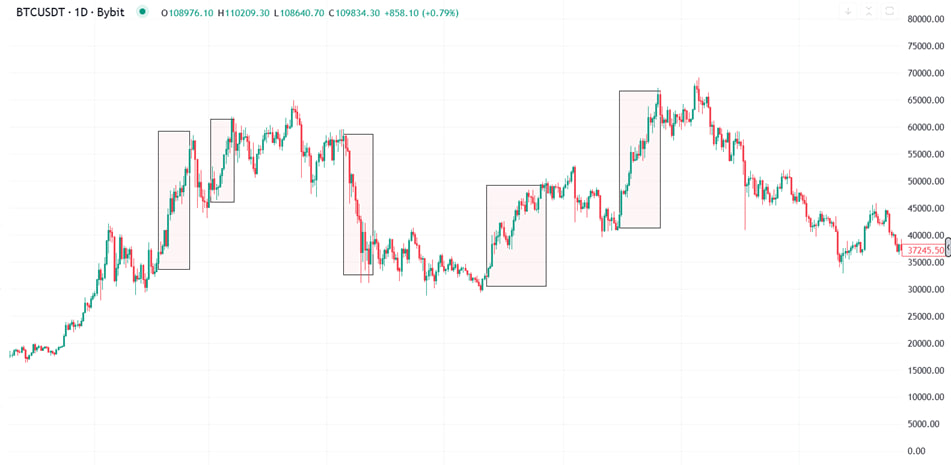
During the rise to $69,000, the price exhibited “whipsaw” behavior—sharp jumps up and down without clear direction. Volumes increased during declines and decreased during rises, indicating major players were selling. When the price broke below support, a significant decline followed, confirming the market was in a distribution phase.
Decision-Making Logic
In the first scenario, a trader could enter the market after the price broke above the accumulation range, with volumes supporting the movement, strengthening the signal. In the second scenario, the appropriate action would be to close long or even open short positions after the price broke below support with increasing volume.
Patience is key. Carefully monitor volume, candlestick patterns, and price behavior near critical levels to understand the market phase and determine the best action.
Common Mistakes in Identifying Phases
Mistaking Regular Consolidation for Accumulation
Prices may remain in a sideways range for extended periods, but this doesn’t always indicate accumulation. Sometimes, it’s merely a pause before further decline. Novice traders often assume that every consolidation signals a rally. Before making decisions, it’s essential to analyze volumes, candlestick structures, and overall market behavior.
Ignoring Volume
Volume is crucial. Neglecting volume changes during price movements can lead to missed signals. For instance, a price increase without volume support may be a false rally. Conversely, a sharp volume increase during a decline indicates active selling. Without volume analysis, understanding market control becomes challenging.
Trading Without Confirming Signals
Some traders enter trades upon spotting a consolidation without waiting for level breakouts, volume confirmation, or candlestick analysis. This approach is speculative and prone to errors. It’s better to wait for strong signals before making trading decisions.
Conclusion
Recognizing accumulation and distribution phases isn’t a magic formula but a skill developed over time. It requires analyzing charts with both observation and understanding. Market logic comprehension comes through practice.
The best way to learn is to study historical charts, identify accumulation and distribution areas, and analyse price and volume behavior. Maintaining a trading journal helps you track mistakes and refine strategies.
Relying on a single signal is insufficient. A combination of factors—volume, candlestick structures, levels, and reactions—provides a reliable picture. Over time, you’ll begin to see previously unclear patterns, making the market more predictable.