Aroon Indicator: Measuring Trend Strength

Contents
- Introduction
- What is the Aroon Indicator
- How the Aroon Indicator Works
- Identifying the Start of a Trend Using Aroon
- How to Measure Trend Strength with Aroon
- Mistakes to Avoid When Interpreting Aroon
- Comparison with other trend indicators (ADX, moving averages)
- Conclusion
Introduction
A brief explanation of the importance of technical indicators in trading
Trading is not about guessing. To make informed decisions, traders need tools. One of these tools is technical indicators. They help reveal what is not always immediately visible—for example, when the market is just beginning to change direction or when a trend is about to weaken. Indicators take data from the chart—price, time, volume—and turn it into signals. Thanks to this, traders can understand when to buy or sell. It is possible to trade without indicators, but the risk becomes significantly higher.
Why traders need to identify trends
The market never stands still. The price is constantly moving upward, downward, or sideways. If traders understand which direction the market is heading, they can open trades with more confidence. When a new trend begins, entering as early as possible is essential. And if the trend is ending, it’s crucial not to stay in the market for too long. The ability to identify trends helps avoid mistakes and catch good entry points.
Introducing the Aroon Indicator: What it is and what it’s used for
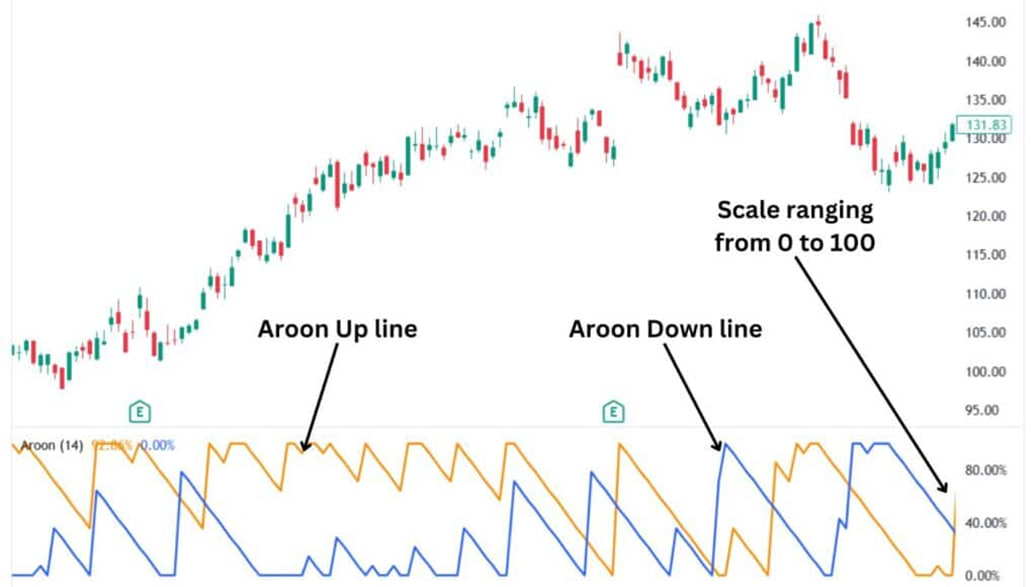
Aroon is an indicator that shows whether a market is trending and how strong the trend is. It was created to help traders identify moments when the market transitions from a sideways movement to a trend. Aroon consists of two lines: one reflects the strength of upward movement, and the other shows the strength of downward movement. If one of the lines is high, buyers or sellers dominate the market. The indicator works well on stock charts, cryptocurrencies, and other assets.
What is the Aroon Indicator
History and creator of the indicator
The Aroon indicator was created in 1995 by Tushar Chande, an engineer and trader who aimed to develop a simple but accurate tool for detecting trends. The name “Aroon” comes from Sanskrit and means “dawn’s light,” symbolizing the start of a new market movement. The idea behind the indicator is to identify the moments when the market “wakes up” and begins a new direction.
The core concept of the indicator
The main goal of Aroon is to show when a new trend has started and how strong it is. The indicator measures the time passed since the last high and low. This helps determine who is currently stronger—buyers or sellers. The closer the most recent high is to the current time, the stronger the bulls. The closer the most recent low, the stronger the bears. The indicator helps answer whether to expect continued movement or if the market will likely return to sideways action.
Components of Aroon
The indicator consists of two lines that range from 0 to 100.
Aroon Up (indicates the strength of an uptrend)
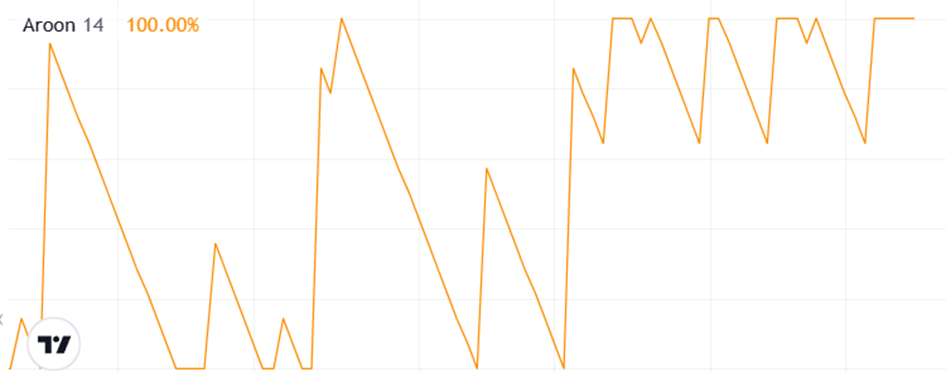
Aroon Up measures how recently the last high occurred on the chart. If the line is close to 100, the high happened recently, indicating buyers are in control. The higher the Aroon Up value, the stronger the upward movement. The trend is likely stable if the line stays near the top of the scale for a long time.
Aroon Down (indicates the strength of a downtrend)
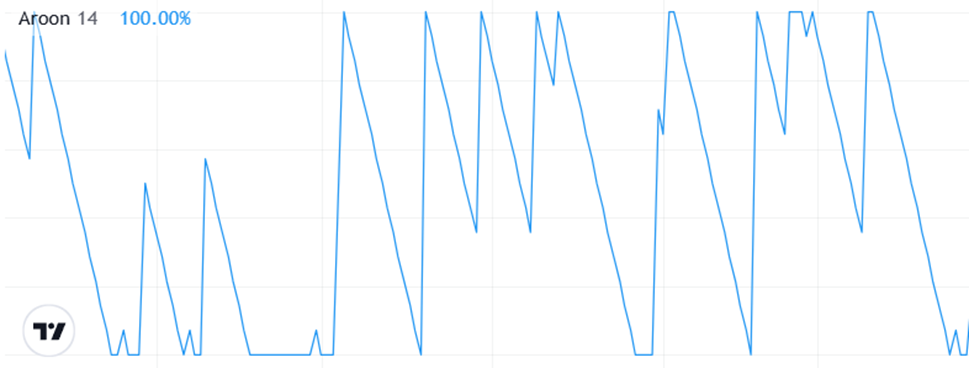
Aroon Down works the opposite way. It shows how recently the last low occurred. If the line is at 100, the low happened just now, indicating that sellers push the price downward. The higher the Aroon Down value, the stronger the bearish pressure. When this line remains high, the market is inclined to decline.
Aroon Calculation Formulas
Aroon is calculated based on the number of days (or candles) since the last high or low. Common periods used are 14 or 25.
-
Aroon Up = [(Period – Number of periods since last high) / Period] × 100
-
Aroon Down = [(Period – Number of periods since last low) / Period] × 100
These formulas allow the indicator to respond quickly to new highs and lows on the chart. The faster a new high or low appears, the higher the line. This provides traders with timely insights into the current market state.
How the Aroon Indicator Works
Interpreting Aroon Up and Aroon Down values
Aroon shows how recently the price has reached a high or a low within the selected period. The Aroon Up line rises when the high was recent; the Aroon Down line rises when the low was recent. If Aroon Up is above Aroon Down, the market is likely trending upwards. If the opposite is true, the market is declining. Both lines near the bottom of the chart may signal the absence of a clear direction.
Determining trend strength
The strength of a trend depends on how high the Aroon lines are. It indicates stable movement if one remains near 100 for an extended time. For example, if Aroon Up stays high while Aroon Down is low, the uptrend continues. The greater the distance between the lines, the stronger the trend. If they begin to converge, the trend may be weakening.
Key threshold levels (e.g., above 70 – strong trend, below 30 – weak trend)
The indicator has essential thresholds. If a line rises above 70, it signals strong momentum. Below 30 suggests a weak or non-existent trend. For example, Aroon Up above 70 means that bulls are in control. If Aroon Down is below 30 simultaneously, it confirms weak seller activity, increasing confidence in the uptrend. The reverse applies for downtrends: Aroon Down above 70 and Aroon Up below 30 indicates intense bearish pressure.
Identifying the Start of a Trend Using Aroon
Crossover between Aroon Up and Aroon Down as a trend change signal
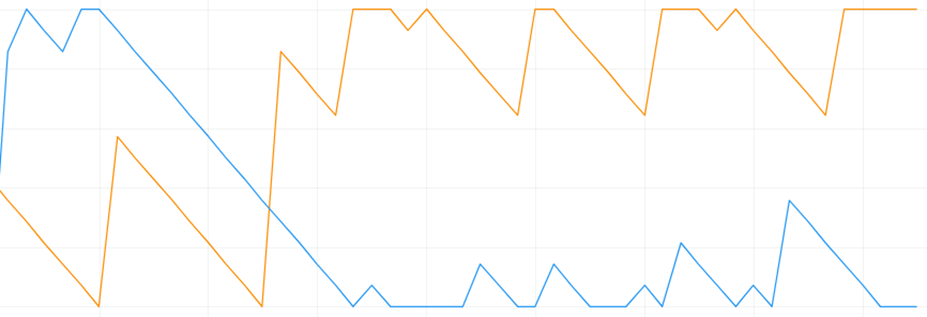
When the Aroon lines cross, it can signal the beginning of a new trend. If Aroon Up rises above Aroon Down, there’s a chance an uptrend is starting. If Aroon Down crosses above Aroon Up, a downtrend may be forming. A crossover doesn’t always mean an immediate reversal, but often signals a shift in market sentiment.
High Aroon Up with low Aroon Down – start of an uptrend
If Aroon Up rises above 70 and Aroon Down drops below 30, buyers will return to the market and push prices higher. This signal often appears at the very beginning of a new uptrend. The longer this difference between the lines persists, the more likely the trend will continue.
High Aroon Down with low Aroon Up – start of a downtrend
The opposite scenario: Aroon Down above 70 and Aroon Up below 30. This indicates that sellers are in control and pushing the price downward. This signal helps traders recognize it’s time to look for short entry points—especially if the lines stay in these zones for several consecutive periods.
How long a trend lasts after an Aroon signal
Aroon doesn’t specify exactly when a trend will end. However, if one line remains high while the other stays low, the trend is likely still active. The longer this divergence between the lines continues, the higher the chances that the movement will persist. When the lines begin to converge and eventually cross, it may be the first signal of a trend reversal.
How to Measure Trend Strength with Aroon
Aroon values near 100 – strong trend
When the Aroon Up or Aroon Down line approaches 100, it indicates intense activity from buyers or sellers. Aroon Up near 100 means the price recently hit a new high; Aroon Down near 100 means a new low occurred. The closer the value is to 100, the more stable the trend. This helps traders decide whether it’s worth entering the market or waiting.
Both Aroon values are in the lower range – no trend (sideways movement)
If both Aroon Up and Aroon Down are below 30, the price hasn’t made new highs or lows for a while. This signals weak movement and a lack of direction. This market condition is called a “flat” or sideways market. In such situations, traders are better off not opening new positions and waiting until one of the lines rises again to indicate the market’s next move.
How to Use Aroon in Combination with Other Indicators
Aroon works well with other tools. For example, you can use RSI to check for overbought or oversold conditions—this helps avoid false signals. MACD can show the acceleration or deceleration of a trend and confirm the direction Aroon suggests. The signal becomes more reliable when two indicators point in the same direction. This combination improves the accuracy of market entries.
Mistakes to Avoid When Interpreting Aroon
Many traders believe that any crossover of lines is a reason to enter a trade. This is a mistake. You need to look at the context. Signals may be false if the market is in a flat (sideways) phase. Aroon should also not be used in isolation. It doesn’t show market participants’ price, volume, or strength. Another common mistake is entering against the trend just because the lines crossed. It’s better to wait for confirmation from other indicators or candlestick patterns.
Comparison with other trend indicators (ADX, moving averages)
Aroon differs from other tools in that it shows the presence and the beginning of a trend. For example, moving averages lag. They give a signal only after the price has already changed. ADX also shows trend strength but not direction. Aroon combines direction and strength, making it helpful in analyzing the early stages of a movement. However, it is best used with other indicators for more accurate decisions.
Conclusion
The Aroon indicator helps traders understand whether there is a trend in the market, which direction it is moving in, and how strong it is. This tool is handy when determining whether a trend has just started or is already weakening. It’s important to remember that Aroon does not provide perfect entry points. It should be used alongside other tools, and traders should closely monitor the chart. When signals are interpreted correctly, Aroon can become a valuable assistant in trading.