Wyckoff Accumulation Phase: How to Spot It

Contents
- Introduction
- The Basics of the Wyckoff Method
- What Is the Accumulation Phase
- The Structure of Accumulation in Wyckoff Theory
- Visual Signs of the Accumulation Phase
- How to Distinguish Accumulation from a Sideways Market
- Practical Examples
- Common Mistakes in Identifying Accumulation
- Conclusion
Introduction
A Brief Explanation of the Importance of Market Phases in Trading
Markets always go through recurring stages. First, the price moves sideways for a long time, then rises. After that, there’s often a wave of selling, which causes the price to fall. These phases repeat over and over. Understanding the market’s current phase helps traders make more informed decisions. Buying at the right time can yield higher profits, while mistakes can lead to losses. That’s why learning how to recognize these phases in advance is essential.
Who Was Richard Wyckoff and Why His Method Still Matters
Richard Wyckoff was a trader and market analyst who lived in the early 20th century. Despite the age of his work, his approach remains relevant and widely used by professionals today. Wyckoff studied the behavior of large market participants — those with significant capital. He discovered that these players don’t buy or sell randomly. They follow a plan and execute it carefully.
The Wyckoff Method helps identify when big money is entering or exiting the market and in which direction it will likely drive the price. This makes it especially useful in modern markets like crypto, where influential players control price movements.
The Basics of the Wyckoff Method
Wyckoff’s Three Laws
Wyckoff’s methodology is based on three core principles:
-
Supply and Demand. The price increases if more people want to buy an asset than sell it. If the opposite is true, the price falls. It’s crucial to observe who is more active: buyers or sellers.
-
Cause and Effect. Major price movements are preceded by a preparation phase — the “cause.” For example, an accumulation phase is the cause; the following price increase is the effect.
-
Effort vs. Result. If there’s a high trading volume but the price barely moves, it suggests someone is absorbing the action, likely a large player. Conversely, if the price moves quickly on low volume, it indicates a different market behavior. This law helps assess the strength of a move and identify who may be behind it.
The “Smart Money” Concept and the Role of Large Players
There are two main types of market participants: retail traders and large institutions like hedge funds, banks, or wealthy investors. These larger players have more capital and access to better information and are often called “smart money.”
Smart money doesn’t buy during market hype or sell in panic. Instead, it creates the conditions to buy low and sell high.
During accumulation, they quietly buy assets from discouraged or fearful people. This process is slow and deliberate to avoid pushing prices up prematurely. Once they’ve built a sufficient position, they initiate a rally that attracts retail traders.
Understanding how these major players operate offers a considerable advantage. If you can spot accumulation, you can align your strategy with the smart money instead of going against it.
Market Cycles: Accumulation, Markup, Distribution, Markdown
According to Wyckoff, the market moves in cycles made up of four phases:
-
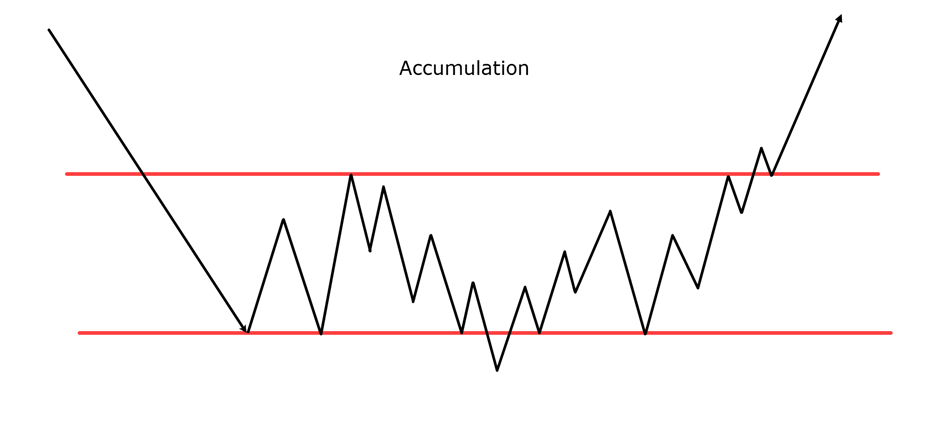
Accumulation. The price moves sideways in a tight range. Large players begin buying. Volume gradually increases. There are no apparent signs on the surface, but internally, significant positioning is taking place.
-
Markup (Growth). Once large players have accumulated enough, the price begins to rise. The move upward is swift, and other traders start joining in. This is when buy signals become visible to the majority.
-
Distribution. After the rally, large players begin selling. Prices remain high, but they are offloading positions. Retail traders often enter here, buying from early entrants.
-
Markdown (Decline). As selling intensifies, prices start to fall. Panic spreads, and late buyers begin to exit at a loss. Meanwhile, smart money is already out and waiting for the next cycle.
Identifying the current market phase is key to developing an effective strategy. Recognizing the accumulation phase is especially important—it allows early entry before the price takes off.
What Is the Accumulation Phase
Definition and Key Characteristics
The accumulation phase marks the beginning of the market cycle. During this stage, an asset’s price fluctuates within a narrow range. There’s no significant growth or decline. To the untrained eye, the market appears inactive. However, beneath the surface, large players are quietly building positions.
They do so gradually, buying small amounts at a time to avoid drawing attention and moving the price upward.
For retail traders, this phase may seem dull. Price action is limited, movements are weak, and volume appears average. But this phase lays the groundwork for the next rally.
How Large Players Behave During Accumulation
A large player cannot buy everything at once — a sudden surge in buying would drive up the price and attract others. So, accumulation is done carefully.
They often create market conditions discouraging smaller participants, such as long sideways movements or sharp, scary drops. When most traders give up or panic, large players start buying.
They buy in waves, allowing the price to return to its range between each wave to avoid suspicion. They continue this process until they’ve built a sufficient position, at which point they’re ready to push the price higher.
Why Retail Investors Often Miss This Phase
Retail traders rarely notice accumulation. On a chart, it looks like a flat market with little movement and no hype. Many assume the market is “dead” and overlook the best entry opportunity.
Most retail traders enter during the markup phase, drawn by news, signals, or excitement. Accumulation, by contrast, is silent and uneventful, which repels them.
Additionally, this phase often includes false breakdowns designed to trigger panic selling. Those who don’t understand the setup exit the market, handing their assets to smart money at bargain prices.
Understanding the accumulation phase offers a critical edge. Those who recognize quiet position-building can enter early and profit far more than those who jump in later, at the peak of public interest.
The Structure of Accumulation in Wyckoff Theory
Accumulation isn’t random — it follows a precise sequence. Each stage reflects a strategic move by large players as they prepare the market for a bullish phase. The most common events in this phase are:
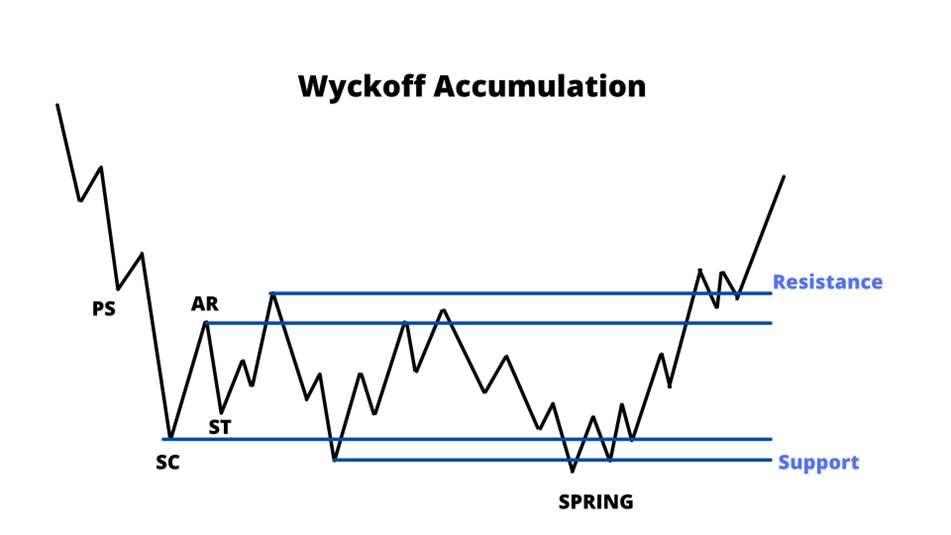
PS (Preliminary Support)
This is the first sign of intense buying pressure in a downtrend. Volume rises, and the decline slows. Large players begin testing the market, buying lightly to assess remaining selling pressure. The price may still fall slightly, but signs of support appear.
SC (Selling Climax)
A sharp, steep decline caused by panic selling. Volume spikes dramatically. Smart money absorbs what panicked traders are dumping. After the climax, the price typically rebounds sharply, indicating sellers have dried up.
AR (Automatic Rally)
A swift rebound follows the climax, mainly because there’s little resistance left. With sellers exhausted, the price climbs almost effortlessly. This level often defines the upper boundary of the accumulation range.
ST (Secondary Test)
The price dips again, but with less volume and panic. Large players are checking if any weak hands remain. If volume drops and previous lows hold, it’s a strong sign the market has been cleansed of excess supply.
SPRING или SHAKEOUT
A sudden move below the established range is a breakdown. In reality, it’s a trap. Large players push the price lower to trigger stop losses and scare away the last weak holders. Then the price quickly snaps back into the range. This is a significant signal that accumulation is complete.
LPS (Last Point of Support)
This is the final pullback before a breakout. Sellers are mostly gone. Volumes may be lower, but buying continues steadily. This is the last opportunity to enter before the markup begins.
SOS (Sign of Strength)
The price breaks out above the accumulation range and holds above it. Volume increases, and the candles grow larger. This indicates that buyers are now in control of the market. A steady rally without pullbacks is a clear sign of strength. Most participants still don’t believe in the uptrend, but the signal has already appeared.
BU (Back-Up)
After the breakout, the price might pull back slightly. This is normal market behavior. The large player allows the market to pause and tests whether the new support level holds. This pullback doesn’t go deep and ends pretty quickly. What follows is the start of the main upward movement — the growth phase.
Visual Signs of the Accumulation Phase
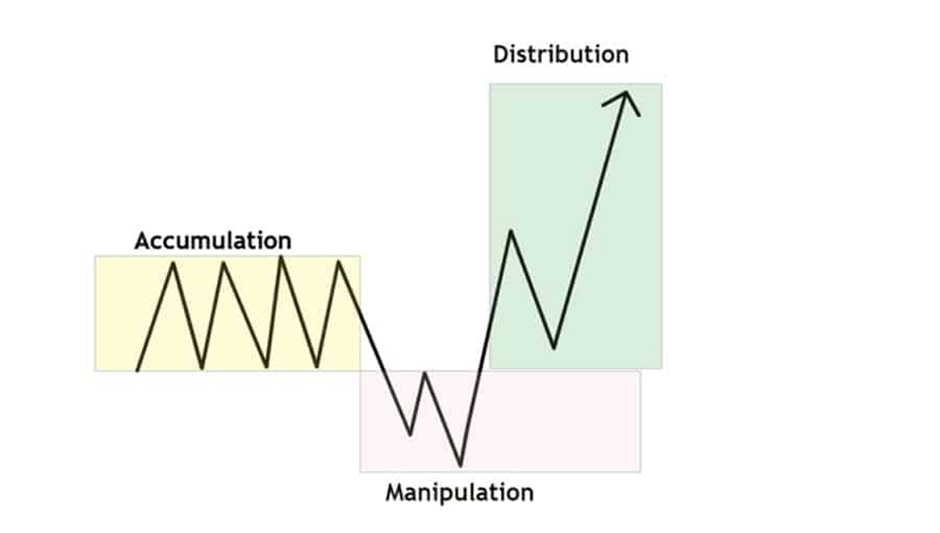
Chart Patterns
The accumulation phase often appears as sideways price movement — a so-called “trading range.” During this period, the chart shows no clear trend. The price moves up and down within a defined range. In the Wyckoff schematic, several key points are visible: initially, the price drops to the lower boundary (SC), then rebounds (AR), retests support (ST), makes a false breakdown (SPRING), and only then breaks upward (SOS). This sequence helps identify when the market has likely finished declining and is preparing for an uptrend.
Volume Behavior at Different Stages
Volume is a crucial signal. When a large player enters the market, they don’t do it all at once. That’s why during the early stages of accumulation, we see a volume spike during the sell-off (SC), followed by a decline in volume. When the SPRING occurs, volume spikes again — this is the large player scooping up the remaining supply. Then, during the breakout (SOS), volume rises again — a sign of strong buying interest. Volume may dip slightly during the pullback (BU) but should not drop significantly. If volume continues to decline, it signals a lack of selling interest.
Support and Resistance Levels
During accumulation, clear boundaries form — the lower (support) and upper (resistance) levels. Support is where buying pressure consistently absorbs sell-offs. Resistance is where upward price moves are halted. Large players use these levels to buy and sell strategically. When price breaks through resistance on rising volume, it’s one of the most reliable signals that accumulation is ending.
How to Distinguish Accumulation from a Sideways Market
Technical Differences
At first glance, accumulation and a typical sideways range look alike — the price simply moves within a range. But there are key differences. Accumulation includes specific events within the range: a sharp drop (SC), a quick rebound (AR), retests (ST), a false breakdown (SPRING), and a breakout (SOS). These stages create a recognizable structure. In a regular range, these signals are missing. Price simply moves back and forth without purpose or increased activity.
Price and Volume Behavior
In accumulation, volume fluctuates at key moments. It rises sharply during strong moves—on declines, fake breakdowns, or breakouts. In a normal sideways market, volume usually remains low. There are no big players, no battle for key levels. It’s a zone where neither buyers nor sellers show strong interest at current prices.
False Accumulations
Sometimes it looks like accumulation is forming, but it’s just a range before further decline. This often happens when key signs like SC, SPRING, and SOS are missing. The price moves within a narrow range, with low volume and no clear breakout attempts. Ranges with a slow downward drift signal, a hidden distribution rather than accumulation. Actual accumulation always features active behavior: volume spikes, quick reversals, and a distinct structure.
Practical Examples
Historical Cases
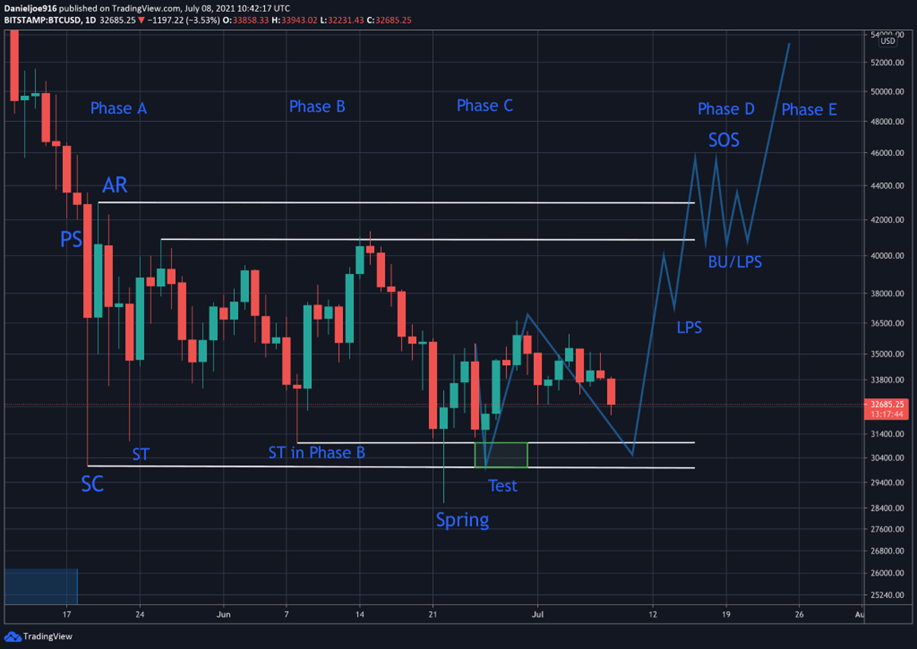
A good example of accumulation is Bitcoin’s price behavior in summer 2021. After a sharp decline, the price stopped setting new lows and began moving sideways. The chart clearly showed all the key Wyckoff elements: preliminary support (PS) came first, then a selling climax (SC) with a sharp drop. The market rebounded (AR) but returned for retests (ST).
Later, a false breakdown occurred—this was the SPRING, followed by a test. This signalled that large players had accumulated positions and shaken out weak hands. Next, the price formed a last point of support (LPS), broke through resistance, and showed signs of strength (SOS)—all of this confirmed accumulation. After the breakout, the market usually enters a growth phase and starts a new trend.
Common Mistakes in Identifying Accumulation
Overly High Expectations
One major mistake is expecting growth too early. Many traders assume that a sideways range means an uptrend is imminent. But not every range is an accumulation. Sometimes the market just isn’t ready to rise. Large players need time to accumulate their positions. Entering a trade too early can trap you in a losing position or even lead to losses.
Insufficient Volume Analysis
Some traders focus only on price and ignore volume — a significant mistake. Volume reveals who controls the market. High volume during a decline might signal large-scale buying. Weak volume during a rally suggests a lack of genuine interest. Without analyzing volume, it’s impossible to distinguish accumulation from a random range.
Ignoring Fake Breakouts
False breakouts are crucial to accumulation. They show how large players mislead weaker participants. A trader unaware of fake breakouts might panic when prices dip below support and sell, while professionals are just beginning to buy. Ignoring these signals means working against the pros and missing significant opportunities.
Conclusion
The accumulation phase is a critical part of the market cycle, yet it is often overlooked. When the price moves sideways, it may seem like nothing is happening. In reality, large players quietly build positions, gradually avoiding pushing prices up too soon.
The Wyckoff method helps decode the structure of accumulation. It reveals potential entry points, shows how volume confirms significant player activity, and guides traders on when to wait and when to act.
Understanding market phases gives traders a real edge. It helps avoid buying at the top and allows entry before major moves begin. The key is patience, attention to detail, and a clear plan. Even in harsh conditions, this approach supports confident decision-making.