How to Identify Trend Reversals in the Crypto Market
Contents
- Introduction
- Core Concepts: Bull and Bear Trends
- Unique Features of Crypto Cycles
- How to Spot the End of a Bull Trend
- How to Spot the End of a Bear Trend
- The Role of Institutional Capital
- Market Psychology and Panic Selling
- External Factors Driving Crypto Cycles
- Conclusion
Introduction
Overview of the Crypto Market and Its Uniqueness
The crypto market is very different from traditional financial markets. It operates 24/7, without weekends or holidays. Not only do large companies trade here, but anyone from anywhere in the world can participate. There are almost no intermediaries in crypto. Anyone can buy or sell an asset directly through an exchange or a decentralized protocol.
Cryptocurrencies are highly volatile—prices can change dramatically within a day or even an hour. This scares off beginners, but it creates profit opportunities for those who understand how the market works.
Why Understanding Market Cycles Matters
Prices in crypto don’t rise forever. After a strong rally, a downturn usually follows. This is called a cycle. Understanding these cycles helps make informed decisions. When someone sees the overheated market, they can exit a position and lock in profits. When prices drop, they can identify a good entry point.
Without understanding cycles, it’s easy to act on emotion. People often buy at the top and sell at a loss at the bottom. Knowing the market phases helps avoid such mistakes and build a long-term strategy.
Core Concepts: Bull and Bear Trends
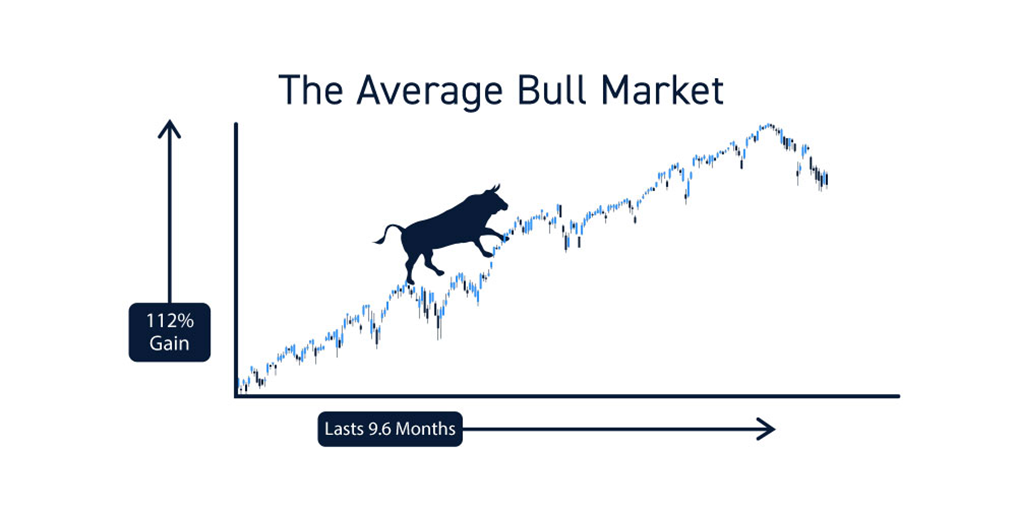
Definition of a Bull Trend
A bull trend is a period of consistent market growth. Prices rise, trading volume increases, and buyers are active. The news is often positive during this phase, and participants are confident. A bull market can last for months or even years.
One sign of a bull trend is that each new wave of growth surpasses the previous one. This shows that demand continues to rise while supply struggles to keep up.
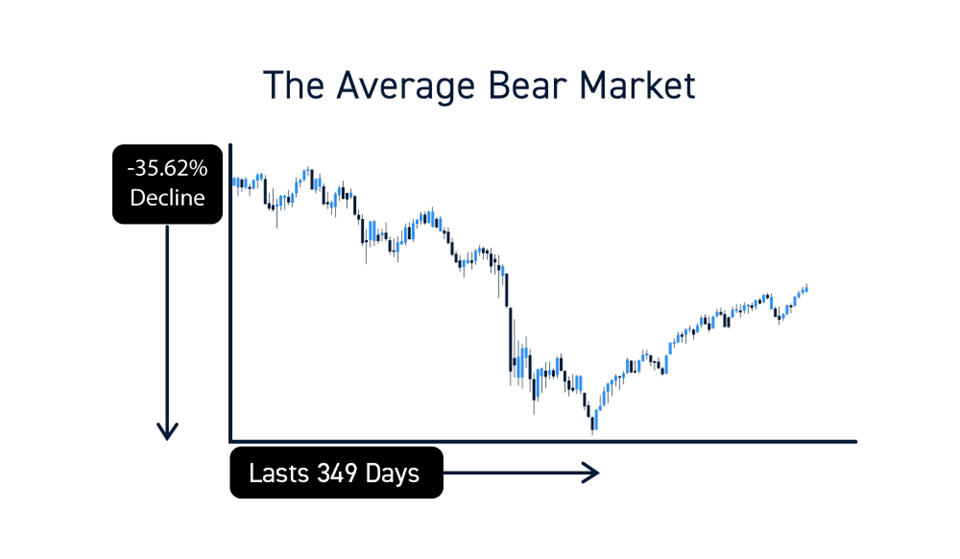
Definition of a Bear Trend
A bear trend is the opposite. Prices gradually decline, many traders exit the market, and the news turns pessimistic. During this phase, fear dominates greed.
In a bear trend, each upward bounce is weaker than the last. This means buyers are losing strength, and the price is heading downward.
These trends don’t switch abruptly. There are often periods of uncertainty between sideways ranges where the market consolidates.
Chart Example
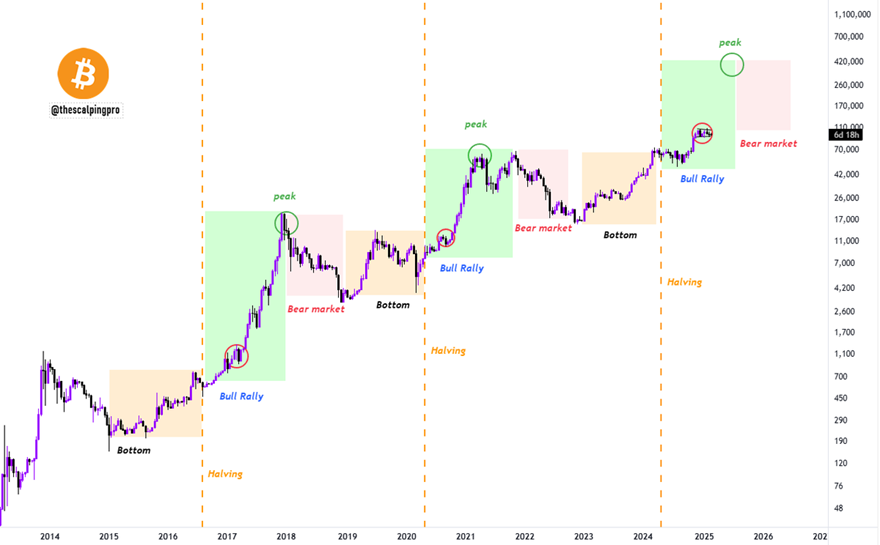
Bitcoin’s chart clearly shows recurring cycles. For example, in 2017, the price surged to $20,000, then dropped below $4,000 within a year, marking the shift from a bull to a bear trend.
The same happened in 2021. After reaching $69,000, a correction began, and over the following year, the price fell nearly threefold, again indicating a cycle change.
Charts help visualize the current market phase. They don’t offer precise forecasts but do provide a broader picture.
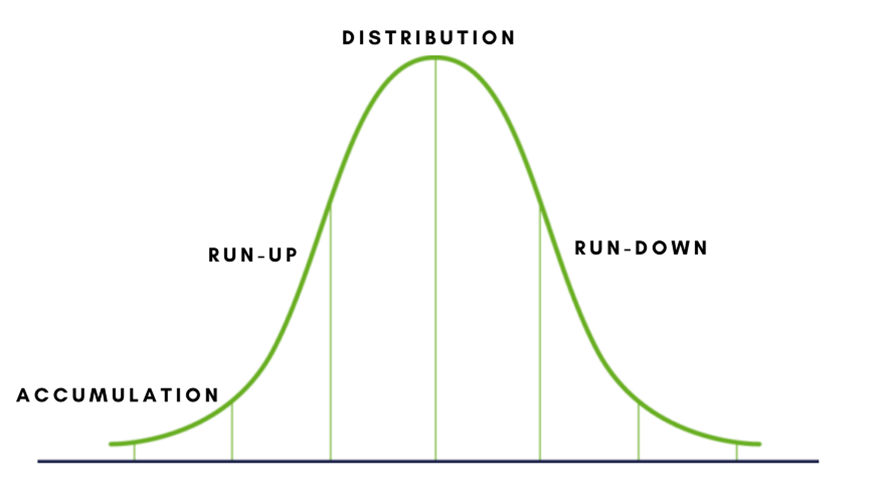
Unique Features of Crypto Cycles
How Crypto Differs from Traditional Markets
The crypto market doesn’t resemble stock or commodity markets. It runs nonstop—no breaks, no sessions. Everything happens online and at high speed.
It’s also far less regulated. Anyone can buy or sell assets without banks or brokers. This provides freedom but also makes the market more chaotic.
Crypto participants often make decisions based on emotion, with fear and greed playing a major role. As a result, sharp price moves are more frequent than in traditional markets.
Volatility’s Role in Cyclicality
Cryptocurrencies are highly volatile. Prices can swing wildly quickly, forming clear waves of growth and decline.
When the market is rising, interest explodes. More people buy in, which pushes prices even higher. But when prices start falling, panic sets in. People sell off, and the drop accelerates. This dynamic creates market cycles.
Volatility speeds up transitions between trends. The market might gain 50% in a month, then drop just as quickly.
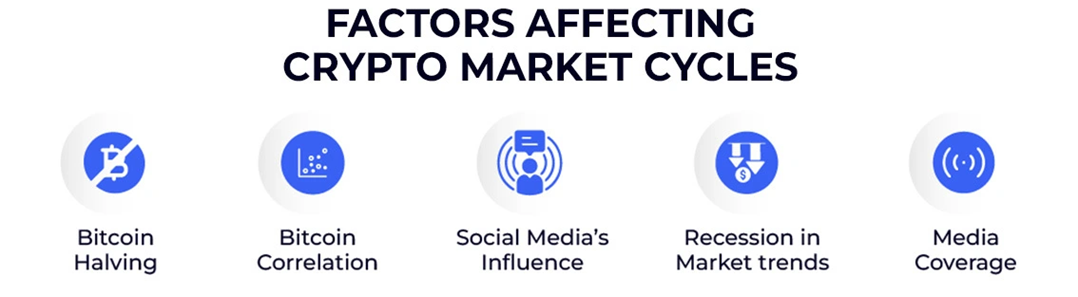
What Drives Crypto Cycles
The crypto market moves in waves due to several factors:
-
News: Positive developments—like ETF approvals or significant partnerships—can trigger rapid growth. Negative news, like a government ban, can cause sharp declines.
-
Technology: Major network upgrades, new solutions, or token launches spark interest and price action. The opposite happens when projects fail to deliver.
-
Regulations: Government action, such as taxes, bans, or exchange policies, can heavily impact the market. Even rumors can move prices.
Cycles reflect the combination of these factors. They repeat because sentiment constantly shifts.
How to Spot the End of a Bull Trend
Analyzing Changes in Trading Volume
When a trend starts losing strength, trading volume often drops. Fewer buyers are willing to enter at current prices.
If rising prices are no longer supported by high activity, it’s a red flag. It shows doubt and hesitation in the market.
Also, watch volume during pullbacks. If volume spikes during a decline, it may signal a trend reversal.
Chart Signals: Divergences and Reversals
Charts can reveal what news doesn’t. A strong signal is divergence—when price makes a new high but indicators don’t. This shows weakening momentum.
Other warning patterns include double tops or head-and-shoulders formations. These often mark the end of an uptrend.
Charts don’t guarantee outcomes, but they help confirm other signals.
Impact of News and Sentiment
Market sentiment is a key factor. If headlines talk about a “new era,” “infinite growth,” or “this time is different,” it’s a warning sign.
When everyone believes in endless upside, a decline usually follows, because the demand has already peaked.
It’s also important to watch who’s entering the market. When new investors start piling in, it may mark the final stage of a bull run.
Using Indicators (RSI, MACD, Moving Averages)
Indicators help detect trend weakness:
-
An RSI over 70 may signal an overbought market and an upcoming pullback.
-
MACD crossovers from above can indicate a shift toward a downtrend.
-
Moving averages show price direction relative to its average. The trend may end if the price suddenly drops below a long-held average.
Indicators work best when combined with charts, volume, and news.
How to Spot the End of a Bear Trend
A bear trend is a prolonged period of price decline. But every drop ends eventually. The key is to catch signs of an upward reversal.
One of the first signals is price holding a support level. If it stops falling, stabilizes, and bounces upward, it may be a turning point. Sentiment also changes—news and social media shift from panic to cautious optimism.
Reversal Patterns on Charts
Charts show when selling pressure fades. Key signals include:
-
Double bottoms
-
Inverse head and shoulders
-
Long sideways consolidations followed by a breakout
-
A price rally with rising volume after a long drop
-
RSI exiting oversold territory
The more signals align, the higher the chance of an actual reversal.
Deep Pullbacks and Recovery Signs
At the end of bear markets, upward moves start to appear. Some are short-lived, but others develop into complete trend reversals.
Watch for:
-
Price breaking local highs
-
Growth on strong volume
-
Less fear in the news, more constructive commentary
-
Altcoins beginning to move—signalling risk appetite is returning
Together, these signs may indicate that a bear trend is ending.
The Role of Institutional Capital
Retail traders don’t just move markets—significant funds and professionals drive major shifts. They don’t dump assets suddenly; they exit quietly.
During early bear trends, prices may rise slowly, but volume drops—a sign that big players are leaving. They aim to avoid triggering panic.
It’s crucial to watch not just price, but also who is investing—or exiting. Institutional moves are often early warning signs.
Market Psychology and Panic Selling
In bear markets, emotions override logic. Former enthusiasts panic. People sell before hitting the bottom, triggering chain reactions. The stronger the fall, the greater the fear.
This snowballs—one sells, then another. Panic drives the market lower. Emotion, not analysis, often ignites major downtrends.
A smart trader stays calm, watches the data, and avoids the crowd’s noise.
External Factors Driving Crypto Cycles
The Crypto Market Doesn’t Exist in a Vacuum. Crypto is sensitive to everything—economics, politics, global news—and sometimes, major moves come from outside the blockchain world.
Examples:
-
Interest rate hikes cause Bitcoin to fall
-
Government-backed blockchain projects boost market confidence
To understand crypto, you need more than just charts—you need global context
Crypto Regulation
Regulatory news has an immediate impact. The effect depends on the nature of the regulation:
-
Bans or restrictions → price drops
-
Legal clarity or acceptance → price rises
Watch the U.S., China, and Europe especially. Central banks, tax authorities, and securities regulators can shift sentiment with a single announcement.
Global Economic Crises
When the broader economy suffers, crypto feels it too. Sometimes, investors flee; other times, they turn to Bitcoin as a haven.
Behavior depends on the severity of the crisis. If banks collapse, people may rush into stablecoins. If stocks crash, crypto is often sold too to preserve capital.
Tech Innovations and Trend Shifts
The crypto market is hypersensitive to innovation. One breakthrough can trigger a new trend.
Examples:
-
Ethereum 2.0 launch
-
Lightning Network integration
-
New token standards
-
NFT platform rollouts
Even rumors can boost interest. Technology is often the spark for a new cycle.
Conclusion
The crypto market is deeply connected to the outside world. Understanding where it’s going requires more than chart analysis. You need to consider politics, economics, regulations, and tech.
The more aware a trader is of these factors, the sooner they spot change—and the more they profit with less risk.