Renko and Heikin Ashi Candles in Crypto Trading
Contents
- Introduction
- General Advantages of the Interval-Based Charting Approach
- Heikin Ashi Candles
- Renko Candles
- Application in Cryptocurrencies
- Comparison Table: Renko vs Heikin Ashi
- Conclusion
Introduction
A brief explanation of the importance of technical analysis in crypto trading
Technical analysis helps traders understand how the price behaves. It is essential for identifying good entry and exit points. In the crypto market, this is especially important because prices can change rapidly. When traders know how to read a chart, they can make quicker and more confident decisions. This reduces risks and helps avoid emotional losses.
What are interval-based candles, and why are traders interested in them
Interval-based candles are a unique way of displaying price charts. Unlike Japanese candlesticks, which are time-based (e.g., one candle = 5 minutes), interval-based candles appear only when the price moves a certain amount. For example, a new candle may form when the price increases or decreases by $100. Time does not matter here—only the magnitude of the price change.
This approach helps remove unnecessary fluctuations and focuses on the actual market movement. It becomes easier for traders to see the trend direction and spot good entry points.
Renko and Heikin Ashi
Among interval-based candles, two popular types are Renko and Heikin Ashi. Renko shows price movement in the form of bricks, each representing a fixed price change. Time is not considered in this chart—only price. Heikin Ashi uses smoothed candles that filter out price noise. They are great for identifying trends and reducing false signals. In the following sections, we’ll explore how both types work and how to apply them in crypto trading.
General Advantages of the Interval-Based Charting Approach
The main advantage is filtering out market noise. On standard charts, candles form even when the price is stagnant, cluttering the analysis. Interval-based candles operate differently: if there’s no movement, there’s no new candle.
Another benefit is clearer trend visibility. Since candles appear only during movement, the chart clearly shows the market direction, simplifying decision-making.
Interval-based charts also help reduce emotional reactions. Traders don’t see every minor fluctuation and instead focus on the bigger picture. This encourages more thoughtful and deliberate actions.
Heikin Ashi Candles
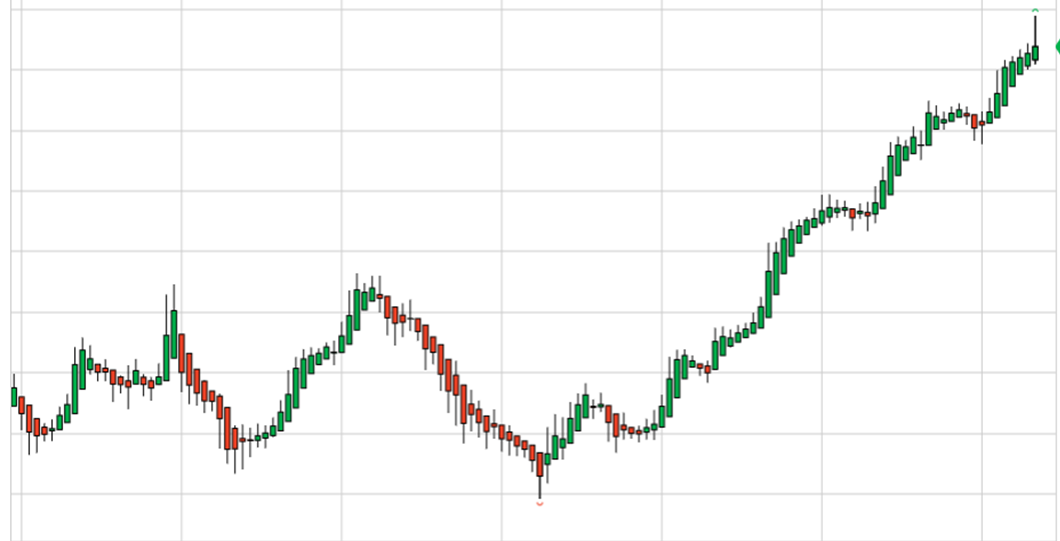
Heikin Ashi is a special candle that smooths out sharp price movements. These charts help traders focus on the overall trend rather than being distracted by small fluctuations.
Calculation Method
Heikin Ashi candles are calculated using current and previous candle data formulas. Here’s how they work:
-
Close = (Open + High + Low + Close) / 4
-
Open = (Previous Open + Previous Close) / 2
-
High = Maximum of High, Open, and Close
-
Low = Minimum of Low, Open, and Close
This method results in a smoother chart. Sharp movements are softened, making trends more straightforward to identify.
Comparison with Standard Candlesticks
On a regular chart, candles can frequently alternate between green and red. This can be confusing—an uptrend might seem to reverse due to a single red candle, even when no significant drop occurred.
Heikin Ashi solves this. If the price is upward, candles are often green for an extended period, indicating that the trend continues. When the trend starts to change, candle colors shift and become smaller. This helps traders spot potential exit points or reevaluate their plans.
Advantages of Heikin Ashi
Smoothing out price fluctuations
Standard candles may frequently jump up and down, even in a clear trend. Heikin Ashi removes such noise, resulting in a more readable chart.
Trend identification becomes easier
Heikin Ashi clearly shows when a trend starts and ends. A series of candles with no wicks in the opposite direction strongly signals a continuing trend, making it easier to time entries.
Fewer false signals
Standard charts often display candles that look like signals but aren’t backed by real movement, creating confusion. Heikin Ashi reduces such cases since new candles reflect sustained movement, reducing false entries, especially valuable in volatile markets.
Drawbacks
Delayed signals
Because Heikin Ashi smooths out price action, signals appear with a delay. For instance, at the start of a reversal, standard candles may reflect the change immediately, but Heikin Ashi requires more data to confirm the shift. This can be a downside when quick decisions are needed.
Not ideal for scalping or intraday trading
Scalpers and intraday traders need to see every small move. Heikin Ashi removes much of this detail. While it’s great for calm analysis, it might hinder fast-paced strategies where precision and speed are key.
Renko Candles
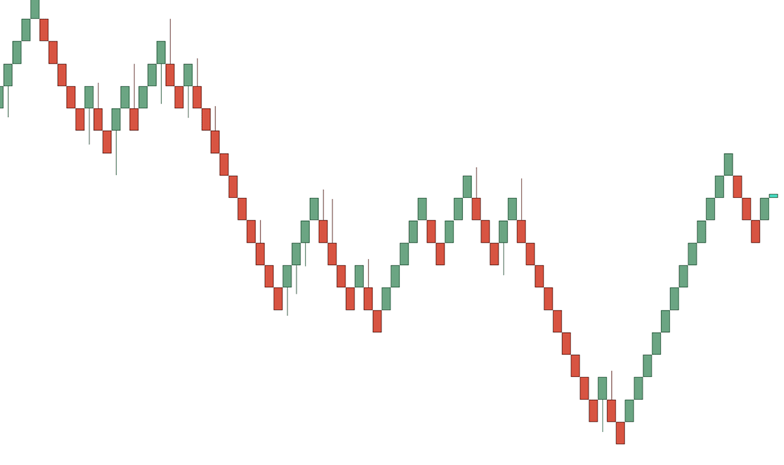
Principle of Construction
Bricks are built based on price movement, not time
Renko charts differ from standard Japanese candlesticks in that they are not time-based. Instead, they use a price step. Each element, called a “brick,” appears only when the price moves a specific amount up or down. No new bricks are added if the price is flat or barely moving. This emphasizes meaningful price moves only.
Types of Renko Charts: Classic, with Wicks, Combined
There are several types of Renko charts:
-
Classic Renko shows only bricks, with no extra details.
-
Renko with Wicks includes data on highs and lows within each move.
-
Combined Renko merges Renko with other candlestick types to offer trend clarity and intra-brick details.
Advantages of Renko
Efficient noise filtering
Standard charts often include a lot of unnecessary movement, making it hard to read the market. Renko removes these minor fluctuations, leaving only clean signals.
Clear support and resistance levels
Support and resistance are evident on Renko charts. Bricks form clean lines where price frequently halts or reverses. These levels are easy to spot and use for precision entries/exits.
Ideal for trend-following strategies
Renko presents trends very clearly. Consecutive bricks of the same color indicate strong movement. A change in color signals a potential trend reversal. This is great for strategies that aim to ride strong trends and avoid early exits.
Drawbacks
Brick formation delay
Since Renko is based on price movement, a new brick forms only after a predefined move; this introduces delay: movement begins, but it’s reflected on the chart only after it passes the threshold. Traders might miss the initial part of the move.
Not suitable for high volatility
In fast-moving markets, Renko may not keep up. Bricks form with a delay, so traders may not see the full extent of the action. During high volatility, quick info is key. Renko is better suited for calm markets and can lag in unstable conditions.
Application in Cryptocurrencies
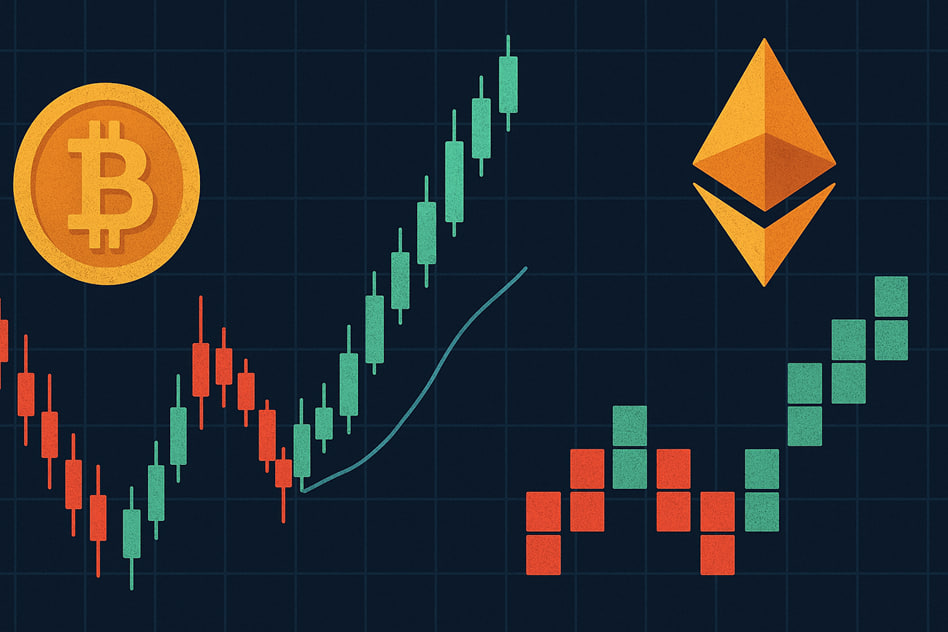
Crypto Market Characteristics
High volatility and 24/7 trading
The crypto market never stops—it operates 24/7, including weekends and nights. Volatility is another defining feature. Prices can spike or crash within minutes, making crypto both exciting and riskier for traders.
The importance of noise filtering
Sudden moves often generate false signals. A price might spike slightly, only to revert quickly. These fluctuations complicate decision-making. It’s crucial to separate meaningful movement from noise. Interval-based candles help with this. They highlight the broader picture and make signals more reliable.
How to Use Heikin Ashi in Crypto
In combination with indicators: RSI, MACD, EMA
Heikin Ashi works well with other tools. RSI shows overbought or oversold conditions. MACD helps spot trend changes. Moving averages (e.g., EMA) indicate overall direction. Combined with Heikin Ashi, these indicators give stronger signals. When multiple tools align, trade confidence increases.
How to Use Renko in Crypto
Brick size settings: fixed and dynamic approach
Setting the brick size correctly is essential when working with Renko charts. This step is crucial because it directly affects the chart’s appearance. There are two main approaches to defining the size: fixed and dynamic.
-
A fixed size means that each brick represents the same price movement, for example, $100. This method is well-suited for calm markets or longer-term trading. It highlights the overall direction and filters out minor fluctuations.
-
A dynamic size, however, adjusts according to current market volatility. When the market is active, the bricks get larger. During periods of low volatility, they shrink. This approach is more flexible and better reflects real-time price dynamics, especially when the market moves quickly. Both methods can be used depending on the trader’s goals and strategy.
Example of setup in popular platforms (TradingView, etc.)
In TradingView, configuring a Renko chart takes just a couple of minutes. A settings window will appear when you open the desired asset and switch the chart type to Renko. There, you can define the brick size manually or use a formula. You can also choose whether or not to display wicks.
Platforms like MetaTrader or NinjaTrader may have slightly different interfaces, but the basic principles remain the same. The key is to choose an appropriate brick size and check how the chart looks across various timeframes. This allows you to fine-tune the parameters to fit your trading style.
Comparison Table: Renko vs Heikin Ashi
Parameter | Renko | Heikin Ashi |
Ease of interpretation | High. Clean chart with minimal noise | Moderate. Smoothed candles, but wicks may confuse |
Trend tracking | Excellent. Clearly shows market direction | Excellent. Helps hold positions confidently |
Signal delay | Present. New brick appears after price movement | Present, but less than Renko |
Noise filtering | Strong. Ignores small price fluctuations | Moderate. Smooths price, but not fully filtered |
Customization | Requires setting a brick size | Uses a standard formula, no extra settings |
Crypto suitability | Ideal for trend phases and stable conditions | Versatile. Works in both uptrends and downtrends |
Best use case | Long-term trends, breakouts | Reversal spotting, managing open positions |
Conclusion
Which candle type to choose, depending on the trader’s goals
Renko, it is worth trying if your goal is simply to understand where the market is heading without being distracted by every slight fluctuation. This chart type strips away unnecessary details and focuses purely on direction. It’s well-suited for traders who follow trends and prefer not to rush decisions.
Heikin Ashi may be a better choice for traders who want to see smoother price movement and capture shifts in market sentiment. These candles work well for intraday strategies and help determine when to exit a position.
Recommendations for demo testing
Before trading real capital, testing both chart types on a demo account is best. This will help you understand how each reacts to price movement, how quickly signals appear, and how comfortable it feels to make trading decisions based on them. It’s a safe way to determine which charting style works better for you.
Caution: No tool offers 100% accurate signals
It’s important to remember that no tool is perfect. Neither Renko nor Heikin Ashi can guarantee precise entry or exit points. Any chart type should be used in combination with other analysis methods. Don’t rely solely on candle shapes—use indicators and consider the broader market context to improve your trading outcomes.