Cryptocurrency Technical Indicators: What Works and What’s Outdated?
Contents
- Introduction
- Popular technical indicators: overview and relevance
- Indicators that are outdated or less effective
- Modern approaches to technical analysis
- Practical recommendations for traders
- Conclusion
Introduction
Technical indicators are necessary for traders to analyze the cryptocurrency market, and they help them make informed trading decisions. However, not all indicators are equally effective: some remain relevant and widely used, while others lose their significance due to changes in market conditions and the development of algorithmic trading.
In this article, we will analyze which indicators continue to benefit crypto traders and which are already outdated and may give false signals.
Popular technical indicators: overview and relevance
The development of the crypto market requires constant data analysis, and technical indicators help traders find entry and exit points from trades. Let’s look at the most common indicators and their relevance in modern market conditions.
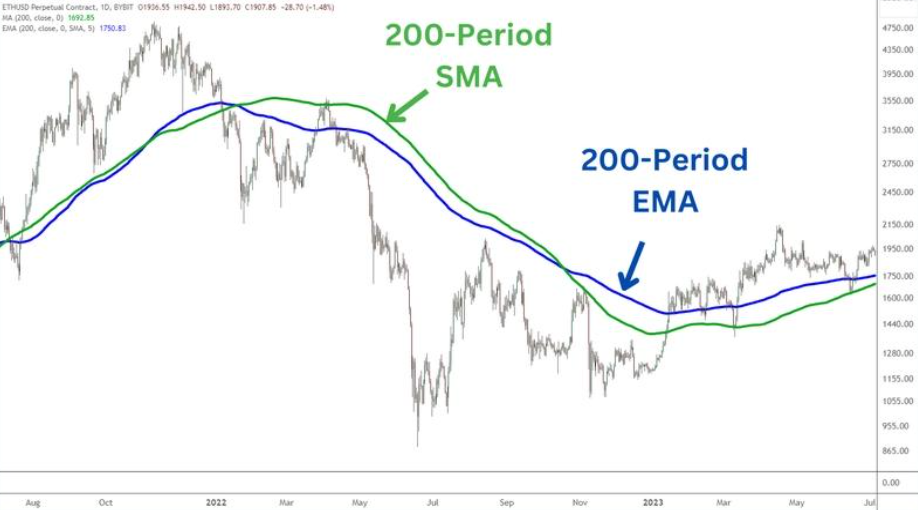
Moving Averages
Moving averages (MA) remain one of the most popular indicators in technical analysis. They help traders determine the direction of the trend and smooth out price fluctuations. Two types are most commonly used:
- Simple Moving Average (SMA) – averages the price over a certain period, reacts slowly, and is suitable for long-term strategies.
- Exponential Moving Average (EMA) – gives more weight to recent prices, responds faster to changes, and performs better in high volatility situations.
Effectiveness of Moving Averages in the Crypto Market
Depends on your goals. The EMA shows more accurate signals, especially for short-term trading, as it adapts faster to sharp price movements. SMA is more suitable for confirming long-term trends.
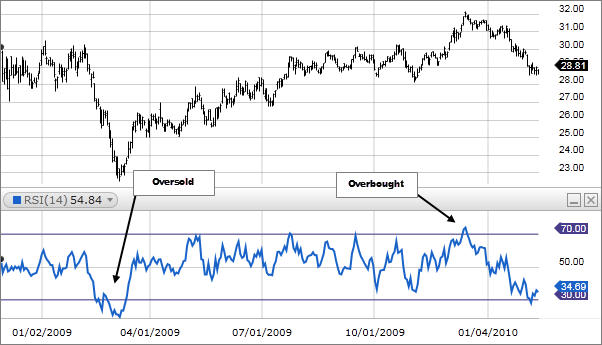
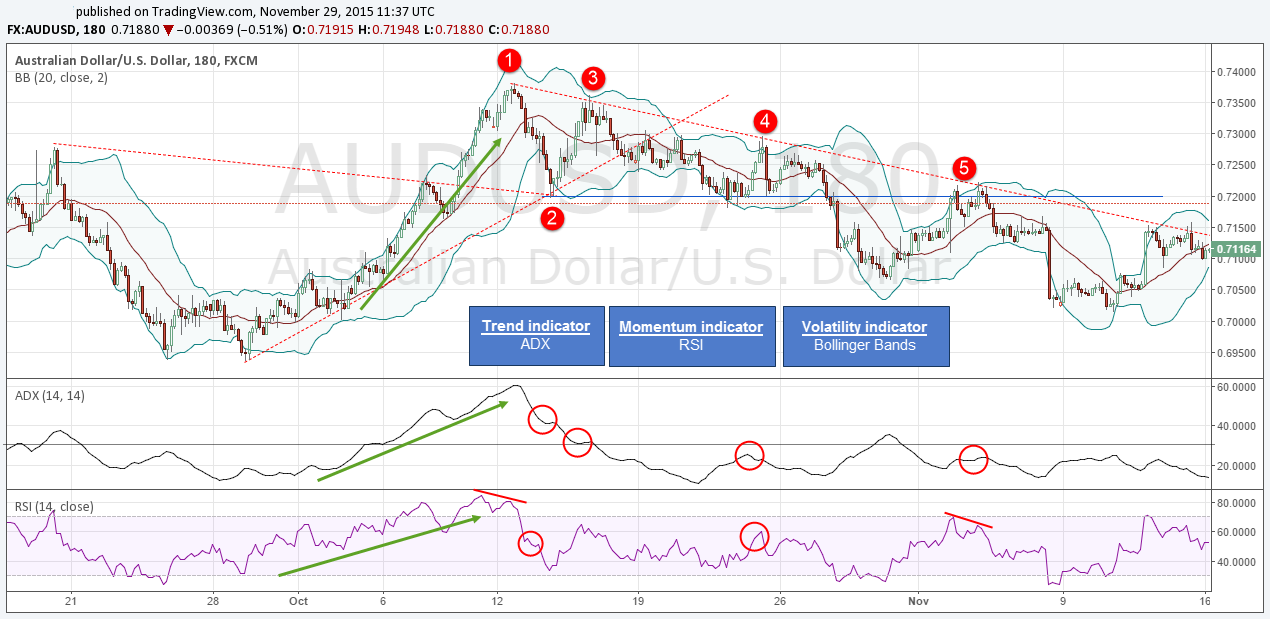
Relative Strength Indicator (RSI)
The RSI (Relative Strength Index) measures the speed and change of price movements. Helps you determine overbought and oversold conditions. For cryptocurrencies, it is especially useful because of their volatility.
RSI Zones:
- RSI above 70 – the asset is overbought, a pullback is possible.
- RSI below 30 – the asset is oversold, and a rebound is possible.
Effectiveness of the RSI on the Crypto Market
The cryptocurrency market often makes sharp movements, which can cause the RSI to quickly enter the overbought (>70) or oversold (<30) zones, but the price continues to move in the same direction.
Classic levels of 70 and 30 can give false signals due to high volatility. More precise settings – RSI 50-80 for a bull market and 20-50 for a bear market
The RSI remains a useful indicator, but in a highly volatile environment, it is worth adapting it using dynamic levels, additional confirmatory indicators, and volume analysis.
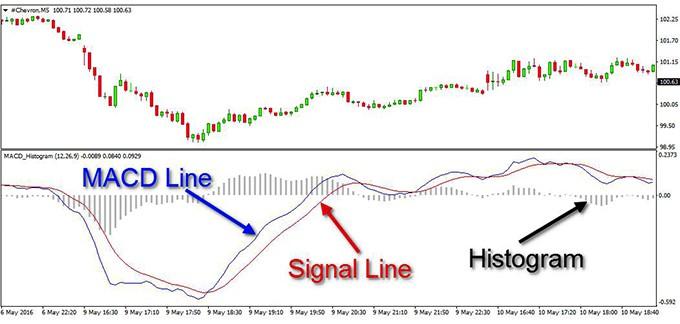
MACD (Moving Average Convergence Divergence)
The MACD is one of the most popular indicators in technical analysis, used to identify trends, the strength of price movements, and possible reversals. It is based on the difference between two exponential moving averages (EMAS)
This is an indicator that works well in trend movements, but requires a correct approach in case of sharp price jumps typical for the crypto market. In such conditions, standard MACD signals may be delayed, so it is important to adapt its use.
Use in conditions of sharp price changes
Crossing of the MACD and signal line
- The MACD crosses the signal line from the bottom up – a possible price increase.
- The MACD crosses the signal line from top to bottom – a possible decline.
In a volatile market, it is better to confirm signals with additional indicators (for example, RSI) since intersections can give false signals.
Histogram
- If the histogram increases – the trend increases.
- If the histogram decreases – the trend weakens, and a reversal is possible.
The histogram is especially useful for assessing the strength of price momentum, which is important during periods of sharp jumps in cryptocurrencies.
Divergence
- The price updates the lows, and the MACD is growing - > possible upward reversal.
- The price updates the highs, and the MACD decreases → possible price decline.
Divergences work more reliably on large timeframes (4H, 1D) but require additional confirmation by other tools.
The MACD remains a useful tool for analyzing the crypto market, but it is advisable to use it in combination with other indicators. In short timeframes, it is less reliable, and in long-term trading, its signals may be delayed. The MACD performs best in combination with the RSI and volumes.
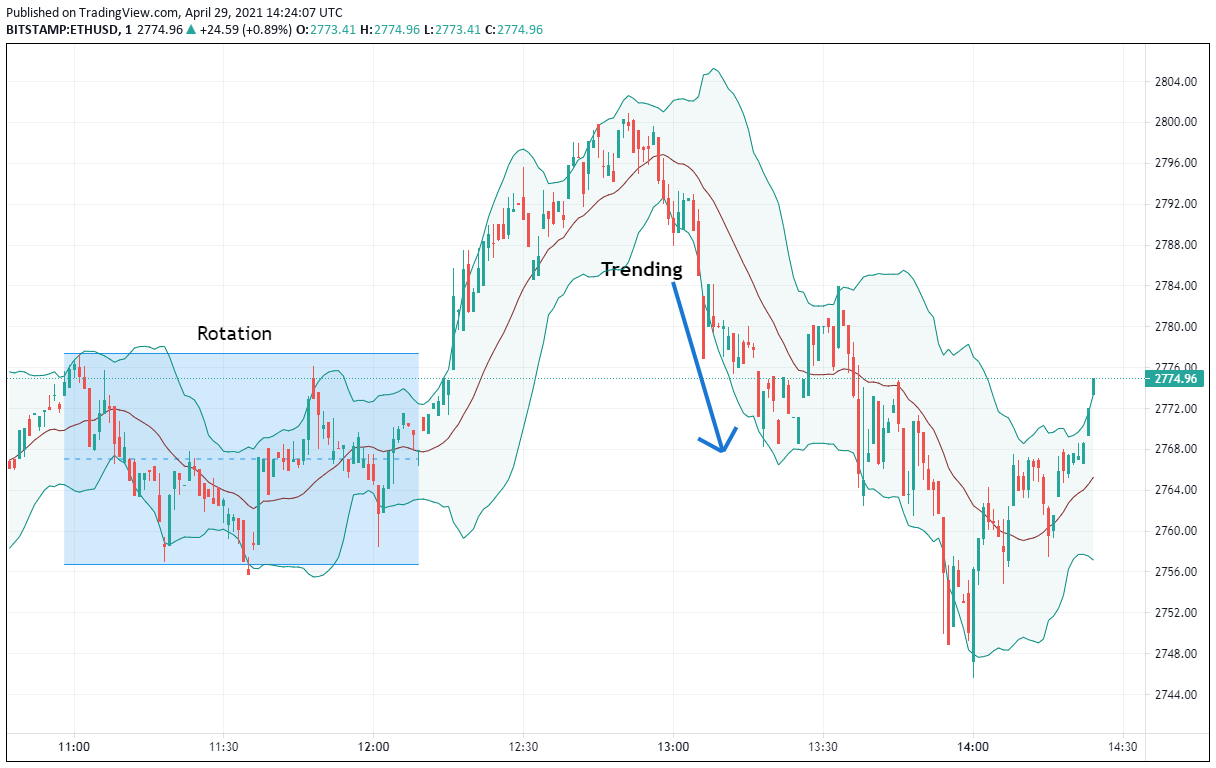
Bollinger Bands
Bollinger Bands is one of the classic technical analysis tools that assesses volatility and helps you find possible reversal points. This indicator remains relevant today, especially in the crypto market, where high price volatility is the norm.
Volatility Analysis: How useful is this indicator today
The indicator bands expand at high volatility and narrow at low volatility. This usually helps traders assess the current market situation and be prepared for sharp price movements. If the bands are strongly extended after a price surge, this may indicate that the market is overheating.
If the bands are strongly narrowed (Bollinger Squeeze), this signals low volatility. As a rule, this is followed by a sharp movement in one direction. However, it is also important to analyze volumes and support / resistance levels.
If the price goes beyond the boundaries of the Bollinger Bands, it often signals overbought or oversold conditions. However, it is important to keep in mind that this is not a guaranteed reversal but only a potential trend deceleration zone. It is recommended that other indicators (RSI, MACD) be used additionally.
Bollinger Bands remains a useful indicator for assessing volatility, but as with the MACD, its effectiveness increases when used in combination with other instruments. It helps traders determine market conditions, periods of possible impulse movements, and overbought/oversold levels, but it does not provide unambiguous trading signals without additional analysis.
Indicators that are outdated or less effective
The crypto market, with its high volatility, low liquidity on individual assets, and the development of algorithmic trading, places new demands on analysis methods. Some tools no longer provide the same signal accuracy or require adaptation. So, let’s look at a few tools that have lost their effectiveness:
Parabolic SAR-lag problem
Parabolic SAR (Stop and Reverse) was originally created for clearly defined trends and should help to determine the moments of change of direction. However, in the crypto market, it faces a number of problems.
Signal lag. Cryptocurrency assets often move in impulses, and sharp reversals can occur faster than the indicator has time to fix it. As a result, Parabolic SAR often signals too late when a significant part of the movement has already occurred.
Frequent false alarms. During periods when the price moves in a range, Parabolic SAR points often change, creating chaotic signals with no clear direction. This results in unnecessary signals to the inputs and outputs.
It doesn’t take into account the volume and strength of the trend. The indicator is simply based on prices, ignoring, for example, market liquidity or the real strength of buyers and sellers.
However, the indicator can still be used. For example, in periods of a stable trend, but only in combination with filters (for example, moving averages), and in general, in strategies where Parabolic SAR is used not as the main tool but as an auxiliary tool for confirming signals.
Volume indicators: the problem of data reliability
Trading volumes are an important part of analysis in traditional markets, but working with them in cryptocurrencies has significant limitations. Next, we will analyze why their reliability is questionable on cryptocurrency exchanges.
Data corruption. Many exchanges use inflated volumes to attract liquidity. This makes indicators such as OBV (On-Balance Volume) and Chaikin Money Flow less reliable, as asset data on exchanges can be forged.
Different volumes on different exchanges. Unlike the stock market, where there is a centralized trading volume, in cryptocurrencies, different exchanges have different liquidity. The same asset can be traded with high volume on Binance, but with minimal volume on another platform. This makes analysis difficult.
High liquidity volatility. Cryptocurrency markets often experience sharp inflows and outflows of liquidity, which makes standard volume indicators less stable in identifying trends.
However, volume indicators are still used, for example, on exchanges with high real volume (Binance, Coinbase, Kraken), as well as in combination with market depth analysis.
Indicators with fixed settings: insufficient adaptability
Most classic indicators, such as the RSI or MACD, have standard settings designed for traditional markets. However, cryptocurrencies, especially low-liquidity altcoins, move much faster than stocks or currency pairs.
Examples of problems with fixed settings:
- The RSI period of 14 may be too slow. The crypto market is more dynamic, and in short-term strategies, the RSI with periods of 7 or even 5 works better.
- The MACD (12.26.9) is lagging behind on sharp moves. In fast trends, the MACD can give a buy signal after a significant part of the increase has occurred.
- Fixed parameters do not take into account market cycles. For example, in a flat market, the RSI 14 may indicate “overbought” or “oversold,” although in reality, the market is simply in a range.
It is better to use dynamic settings, adjusting to the asset and time frame. For example, in short timeframes (5-15 minutes), the RSI (7) or MACD (6,13,5) may be more accurate.
The crypto market is changing rapidly, and standard indicators that have worked well in traditional markets need to be revised. Parabolic SAR is too slow for sudden movements, volume indicators suffer due to manipulation, and the fixed parameters of many indicators do not take into account the features of cryptocurrency volatility. Modern traders should not only choose indicators wisely, but also adapt their settings, as well as combine them with more accurate tools.
Modern approaches to technical analysis
Classical methods of technical analysis are gradually losing their effectiveness in the crypto market due to high volatility, manipulation, and the development of algorithmic trading. Modern traders adapt their strategies using more advanced indicators, algorithmic approaches, and on-chain analytics.
Using adaptive indicators: examples and benefits
Standard indicators, such as moving averages or RSI, use fixed parameters (for example, periods of 14, 50, 200). However, the crypto market is unstable, and such settings are often delayed and can give false signals
Examples of adaptive indicators:
- KAMA (Kaufman Adaptive Moving Average) – dynamically changes the sensitivity to the trend, reducing the delay.
- ALMA (Arnaud Legoux Moving Average – smooths out noise while maintaining the accuracy of signals.
- Adaptive RSI – changes the calculated length based on current volatility.
Their main advantages are that they adapt to the market, reducing the number of false signals, less lag in trend periods, and more accurately identify key points on the chart.
The impact of algorithmic trading on the effectiveness of classic indicators
Algorithmic strategies (HFT, market making, arbitrage) occupy a significant share of trading on crypto exchanges. This affects classic indicators as the market becomes less predictable.
Algorithms can artificially create short-term trends and then dramatically reverse the price. This leads to an increase in the number of false signals, especially for trend indicators such as moving averages and MACD.
And big players use algorithms to gradually accumulate or distribute positions, masking their actions. This complicates the interpretation of indicators such as the RSI and Stochastic, which can show overbought or oversold conditions, but without a real change in demand.
In general, algorithmic trading has changed the crypto market, making classic indicators less reliable. For effective analysis, traders need to combine technical and on-chain indicators, as well as take into account data from the order book and volume distribution.
But suddenly, if the knowledge and experience are not enough for high-quality trading algorithms, there is an investment platform TradeLink where you can invest in crypto-indices made up of the strategies of the best algorithmic traders. The platform has the ability to regulate risks and a wide range of profitable indexes.
Alternatively, if you are an experienced algorithmic trader, you can place your own indexes on the TradeLink Marketplace, where you can attract investors to your crypto indexes. TradeLink products allow a trader to get complete statistics on your exchange account, analyze the data obtained using hundreds of analytical indicators, and show potential investors a report on income from an independent platform, thereby increasing their confidence.
Enabling data from the blockchain (on-chain indicators) for more accurate analysis
Technical indicators analyze only price and volume, but do not take into account fundamental processes. However, the cryptocurrency market has a unique advantage-the transparency of the blockchain. On-chain indicators analyze data directly from the network, allowing traders and investors to make more informed decisions.

How to use on-chain analysis in trading?
On-chain analysis provides traders with additional tools to assess the state of the market using data directly from the blockchain. Here’s how to use on-chain data in trading:
- Filter out false signals from technical indicators.
- Use online metrics such as NVT Ratio or Whale Activity to confirm or deny signals from technical indicators (such as the RSI). This helps you avoid making false trading decisions.
- Identification of accumulation and distribution zones
- On-chain indicators such as MVRV and Exchange Flow help to identify moments when large players (whales) accumulate assets or sell them off. This gives you an idea of potential reversal points.
- Trend strength assessment
- If the price increase is accompanied by an increase in transaction activity on the network, this confirms the strength of the trend. This can be used to confirm that you will continue moving in the same direction.
- Market reversals
- For example, if large holders start withdrawing funds from exchanges, this may signal a possible trend reversal or preparation for long-term accumulation.
- Confirmation of signals from other sources
- On-chain data helps confirm signals obtained through technical analysis or fundamental factors, adding accuracy to trading strategies.
On-chain analysis helps traders gain a deeper understanding of what is happening inside cryptocurrency networks and how it relates to market trends. Using data on transactions, the activity of large holders, and the flow of funds, traders can make more informed decisions.
Practical recommendations for traders
How do I choose an indicator that is suitable for a particular strategy?
Each indicator is suitable for a specific market situation.
- For trend strategies: it is better to use indicators such as moving averages (SMA, EMA) or MACD, which help to identify the direction of the trend.
- For countertrend strategies: it is more effective to use the RSI or Stochastic Oscillator, which shows oversold and overbought moments.
- For volatility analysis: Use Bollinger Bands, which helps you identify potential periods of volatility. Choose the indicator depending on what you want to analyze: trends, volatility, overbought/oversold levels.
The value of an integrated approach: combining multiple indicators
A comprehensive approach to trading is the use of several indicators simultaneously to improve the accuracy of trading decisions. Instead of relying on just one signal, traders combine different tools for more reliable and confirmed results. This helps you analyze the market more accurately, minimize false signals, and take additional factors into account.
Each indicator provides information about the market from a specific point of view, and when combined, they can provide a more complete picture. For example, if the RSI signals an oversold asset and the MACD confirms the beginning of a bearish trend, this may be a more reliable sell signal than using just one of these indicators.
Also, some indicators are focused on trends (for example, SMA or EMA), others-on volatility (for example, Bollinger Bands), and still others help to analyze the state of overbought/oversold conditions (for example, RSI). Combining them, you get a more comprehensive picture of the market situation.
To sum up, combining multiple indicators improves the accuracy of your trading decisions, minimizes risks, and filters out false signals. This integrated approach is particularly useful in highly volatile markets such as cryptocurrencies, where traditional methods may not always be effective.
Testing strategies using historical data
Use high-quality historical data. For testing, it is important to choose reliable and accurate data. Platforms like TradingView or MetaTrader provide historical data on prices and volumes that can be used for backtesting. Make sure that the data spans at least a few months or years to see how the strategy works in different market conditions.
But before you start testing, set up your strategy clearly: select indicators (for example, RSI, MACD, SMA), parameters (periods, levels), and entry/exit rules. For example, if you use the EMA and RSI, set the periods of these indicators and conditions for opening trades (for example, buy at the intersection of the EMA and oversold RSI).
Testing is not a one-time task. Markets are changing, and a strategy that worked before may not be suitable in the future. Therefore, regularly review and test your strategy based on new market data.
Conclusion
Technical indicators remain the most important tools for analyzing cryptocurrency markets, but their effectiveness depends on the correct choice and application context. Indicators such as the RSI, MACD, and Bollinger Bands continue to be relevant, especially when properly configured and combined with other analysis methods. At the same time, some tools, such as Parabolic SAR or volume-based indicators, may be less effective in the cryptocurrency markets due to their high volatility and specificity.
With the development of technology and the introduction of new tools, such as on-chain analysis and algorithmic trading, traders are opening up new opportunities for market analysis. And as we found out above, it is important to approach the use of indicators with a comprehensive strategy, taking into account not only technical signals, but also market conditions, fundamental factors and the behavior of market participants.