DOM in Crypto Trading: How It Works and Uses
Contents
- Introduction
- What is Depth of Market (DOM)
- How DOM works
- How DOM is used in crypto trading
- How large orders can affect price behavior
- DOM only shows limit orders, does not reflect hidden orders
- The danger of overestimating the DOM
- Manipulation of DOM by large players (e.g., spoofing)
Introduction
What is DOM
DOM stands for Depth of Market. It is a tool that displays limit orders to buy and sell an asset in real time. Simply put, DOM is a table: at the top are those who want to sell, and at the bottom are those who want to buy. Orders are arranged by price—those closer to the middle are willing to trade at or near the current market price, while those further away are waiting for a better price.
Why understanding DOM matters in crypto trading
DOM helps traders see where market participants place their orders, providing clues about potential price movements. For example, a large buy order might act as a support level—the price is unlikely to break below it easily. Conversely, a large sell order might act as resistance. DOM not only displays prices but also shows trader interest, offering insight into where movements may begin or where reversals could occur.
Who benefits from using DOM
DOM is beneficial for intraday traders. Scalpers rely on it constantly. They look for moments when large orders appear in the order book to plan their entries and exits. Active traders also monitor the DOM to better sense the market’s mood.
Even beginners should develop a basic understanding of how the DOM works, as this helps them grasp page mechanics. With experience, this tool becomes an essential part of analysis.
What is Depth of Market (DOM)
DOM = Depth of Market
DOM is a tool that shows how many participants want to buy or sell an asset. It reflects how buying and selling interest is distributed across different price levels. DOM helps you gauge how active the market is and in which direction the price might move. If one side of the order book becomes crowded, the price may soon shift in the opposite direction.
What does the DOM consist of
DOM always consists of two columns: buy orders and sell orders.
-
Buy orders are called bids. These are participants who want to buy at a specific price. Bids are usually at the bottom of the order book.
-
Sell orders are called asks. These are participants who want to sell. Asks are placed at the top of the book.
Each row shows the price and volume. The price indicates the level at which the participant is willing to buy or sell, and the volume reflects how many units of the asset they are ready to trade at that price.
What the DOM looks like on a trading platform
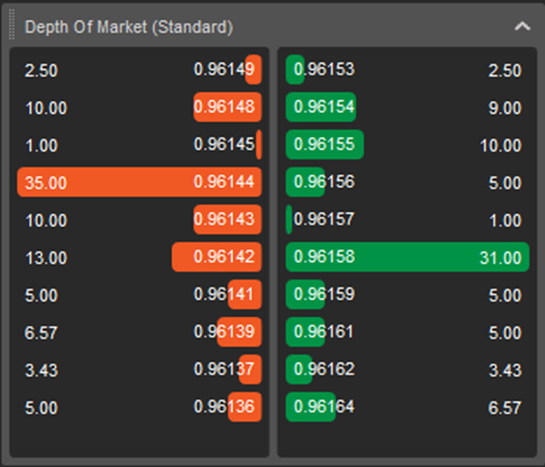
On exchanges, DOM appears as a table. On the left and right are numbers. One column displays buy orders, and the other displays sell orders. The current market price is shown in the centre. Orders closer to this price are filled first. The further away from the market price, the longer an order has to wait to be filled.
Tables are often colour-coded—for example, green for buy orders and red for sell orders—to help with quick orientation. This allows you to spot huge orders, which may influence price behavior.
How DOM works
How orders appear in the book
When traders want to buy or sell crypto, they send an order to the exchange. If it’s a limit order, it enters the order book — the table with prices and volumes. The book shows how many people are willing to buy or sell at various price levels. These orders wait until someone agrees to their conditions.
The book is constantly updated: old orders are filled or cancelled, and new ones are added. It is a live snapshot of current market sentiment.
The role of limit and market orders
-
A limit order specifies the price a trader wants to buy or sell. It doesn’t get executed right away unless there’s a matching counter-order. Limit orders make up the DOM itself.
-
A market order doesn’t specify a price — the trader simply says, “Buy or sell at the current market price.” It is executed instantly, consuming the available volume in the book.
Market orders don’t appear in the DOM, but they sweep the book, removing opposing orders and shifting the asset’s price.
How trades are executed in the DOM
A trade occurs when two participants meet: one willing to buy, the other to sell. For instance, if a sell order is $30,000 and someone sends a market order to buy, the system matches them. The trade happens at $30,000. The volume in the book decreases by the size of the executed order.
If the market order is large, it may consume multiple limit orders, which can lead to a price shift.
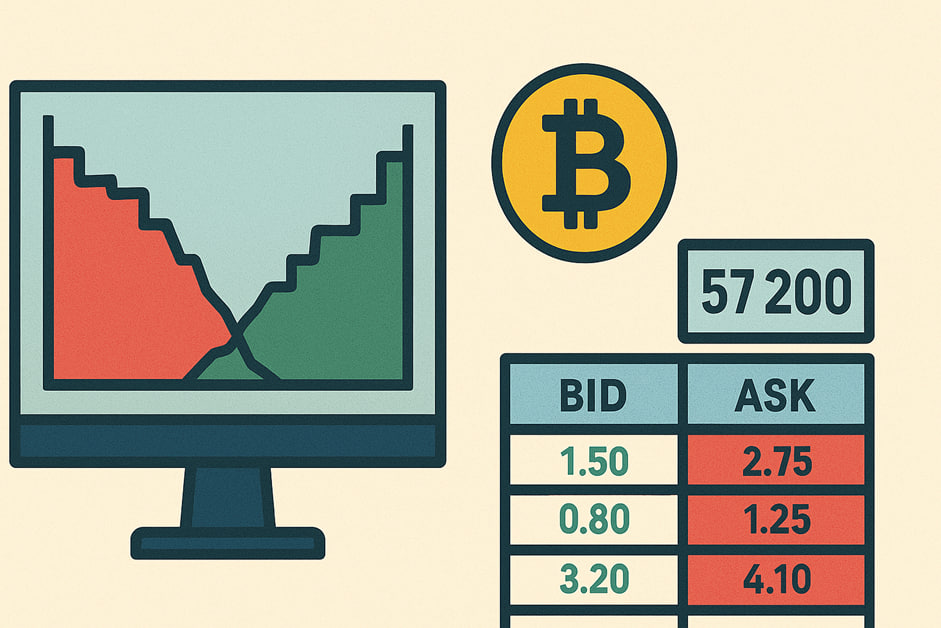
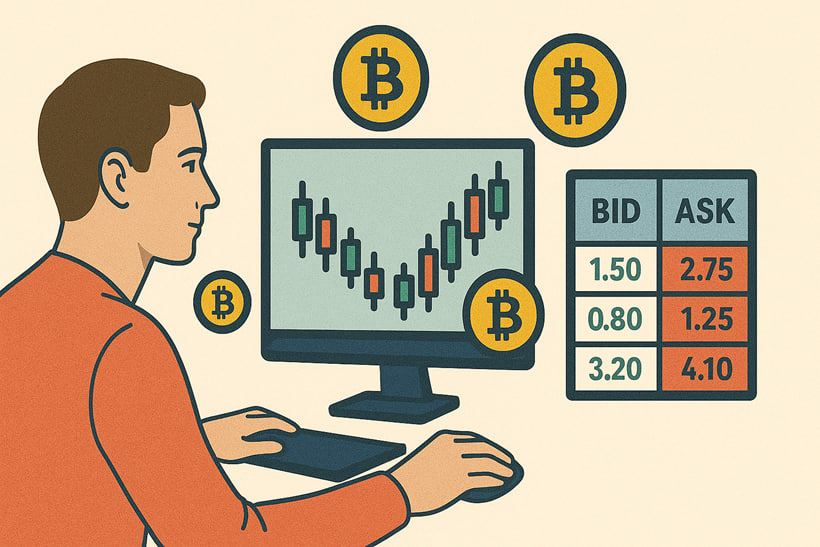
What is the spread, and why does it matter
The spread is the difference between the highest bid and the lowest ask. For example, if the best bid is $29,900 and the best ask is $30,000, the spread is $100.
The smaller the spread, the easier it is to enter a trade with minimal slippage. On liquid markets, the spread is typically narrow. On illiquid ones, it’s wide, which can cause immediate losses after entering a position. Spread is especially important for scalpers who make many quick daily trades.
How DOM is used in crypto trading
Assessing the current liquidity of an asset
DOM helps determine how easily crypto can be bought or sold at the market price. If the book has many large-volume orders, liquidity is high — trades can be executed without major price shifts. Even small trades can cause significant price changes if there are few orders. DOM helps assess these risks in advance.
Evaluating the strength of buyers and sellers
DOM always shows where large orders are placed.
-
If there are many large buy orders, it suggests strong demand — market participants are willing to support the price.
-
If most large orders exceed the current price, it may indicate selling pressure. Analyzing orders helps determine who’s in control — bulls or bears.
Finding support and resistance levels
DOM helps identify key levels where price may stop or reverse. For instance, if many limit buy orders are placed at $27,000, it may act as a support zone — a level below which the asset struggles to fall. If there are many sell orders at $28,500, that level may act as resistance. These zones are crucial for planning entries and exits.
Assisting in scalping and intraday trading
DOM is beneficial for short-term traders. Scalpers and day traders use it to assess market conditions quickly. Changes in volume and order placement can signal upcoming moves. For example, a large order suddenly appearing or disappearing could be a call to action. DOM allows for quicker and more accurate decisions than relying solely on chart analysis.
How large orders can affect price behavior

Large orders in the book act as signals. A big buy order may push the price up — market participants see someone is willing to buy a large amount, which draws in more buyers hoping for price growth.
Conversely, a large sell order may scare the market — traders start selling before the price drops. Sometimes, the price begins to move even before the big order is filled — its mere presence can spark a reaction.
However, such orders aren’t always genuine. Sometimes they’re placed just to influence trader sentiment. Even then, they can shift the price — if only temporarily.
DOM only shows limit orders, does not reflect hidden orders
The DOM displays only the visible part of the market—limit orders placed publicly at specific prices. But exchanges also have hidden orders, which do not appear in the DOM until they begin to execute.
As a result, the order book may present an incomplete picture. For example, there are few buyers at $25,000. But if a large hidden order is placed there, the price may suddenly stop or reverse. DOM won’t show this in advance, leaving traders unprepared.
This is why you should never rely solely on what’s visible in the DOM. The hidden side of the market can change everything, reducing analysis accuracy and increasing risk.
The danger of overestimating the DOM
Some traders view DOM as the complete picture of the market. They base their decisions solely on it, which can lead to mistakes.
For example, a trader sees a large buy order and enters a long position, expecting a price increase. But the order may be fake or quickly cancelled. The price then moves in the opposite direction, and the trader takes a loss.
DOM is just one tool. It’s valid but not complete. It’s best used with other tools — charts, volume analysis, and trade tape — to reduce random influences and make more informed decisions.
Manipulation of DOM by large players (e.g., spoofing)
Large market participants can use DOM to mislead others. One method is spoofing, which involves placing a large order without the intention of executing it.
For example, a trader places a massive sell order slightly above the current price. Others see it, assume selling pressure is growing, and start selling themselves. The price drops. At that point, the spoofer removes their order and buys at the lower price.
Such manipulations distort the market’s appearance. Traders relying solely on DOM can fall into a trap. To avoid this, watch how orders behave: how long they stay, whether they’re executed, and if they reappear. This can help detect suspicious activity and avoid deception.
Conclusion
DOM (Depth of Market) shows where demand and supply are concentrated. It helps to understand potential price movements in the near term. This is especially useful for intraday trading, where quick reactions to market changes are crucial.
However, DOM is not a forecast—it only reflects current activity. Combine it with charts, indicators, and volume analysis to use it effectively. These tools provide a complete market picture and help avoid traps like fake orders.