What is Trading Volume (Volume) and How to Interpret It?
Contents
- Introduction
- What is Trading Volume
- How Trading Volume is Calculating in Financial Markets
-
- In the cryptocurrency market, trading volume is measured by the number of tokens exchanged or their monetary equivalent.
- In the stock market, trading volume is determined by the number of shares bought and sold.
- Due to the Forex market’s decentralized structure, measuring volume is more challenging. Three main estimation methods are used: exchange-based, quantitative, and tick-based.
-
- Difference Between Trading Volume and Liquidity
- Why Trading Volume is Important
- How to Interpret Trading Volume
- The Role of Trading Volumes in Financial Markets
- How to Use Trading Volumes in Trading Strategies
- Example of Volume Analysis Using Indicators
- Common Mistakes in Volume Analysis
- Conclusion
Introduction
Trading volume plays a crucial role in analyzing market activity. It allows investors and traders to identify trends, make informed decisions, and assess the level of market participants’ interest in a particular asset.
What is Trading Volume
Trading volume refers to the number of assets bought and sold within a specific time frame.
For example, if Bitcoin’s daily trading volume is 50,000 BTC, traders have exchanged 50,000 Bitcoins within a day.
How Trading Volume is Calculating in Financial Markets
In the cryptocurrency market, trading volume is measured by the number of tokens exchanged or their monetary equivalent.
Each trade counts only once when calculating trading volume, regardless of the number of participants.
For instance, if one trader sells 4 BTC at $100,000 per Bitcoin, the total transaction value will be $400,000. Another trader buys these 4 BTC for the same amount. Despite both parties’ participation, the recorded trading volume is $400,000 since only the actual asset exchange is considered, not the total amount paid by each side.
In the stock market, trading volume is determined by the number of shares bought and sold.
The average volume (Average Volume) represents the average number of shares traded per session.
Due to the Forex market’s decentralized structure, measuring volume is more challenging. Three main estimation methods are used: exchange-based, quantitative, and tick-based.
Exchange-based – considers the number of shares bought and sold; applied on exchanges.
Quantitative – records the number of trades without considering their size.
Tick-based – tracks the number of price changes. For example, if an asset’s price changes by one pip within a minute, it is counted in the trading volume. This method is used in over-the-counter markets.
Difference Between Trading Volume and Liquidity
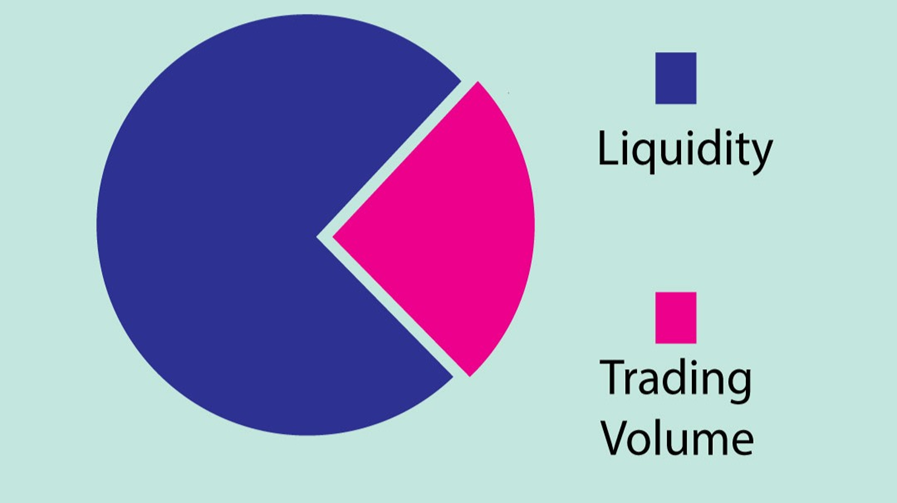
Trading volume and liquidity are related but not identical.
-
Trading volume reflects how many units of an asset were bought and sold over a certain period. It indicates market activity but does not guarantee that trades can be executed without affecting the asset’s price.
-
Liquidity measures how easily an asset can be bought or sold at the current market price without causing significant price changes. High liquidity means that even large trades are executed quickly without sharp price fluctuations.
In simple terms, volume shows the number of transactions, while liquidity determines how much of an asset can be traded without significantly impacting its price.
Why Trading Volume is Important
The Role of Trading Volume in Determining Market Liquidity
Trading volume is used as one of the indicators of liquidity in the cryptocurrency market, but it is not directly defined.
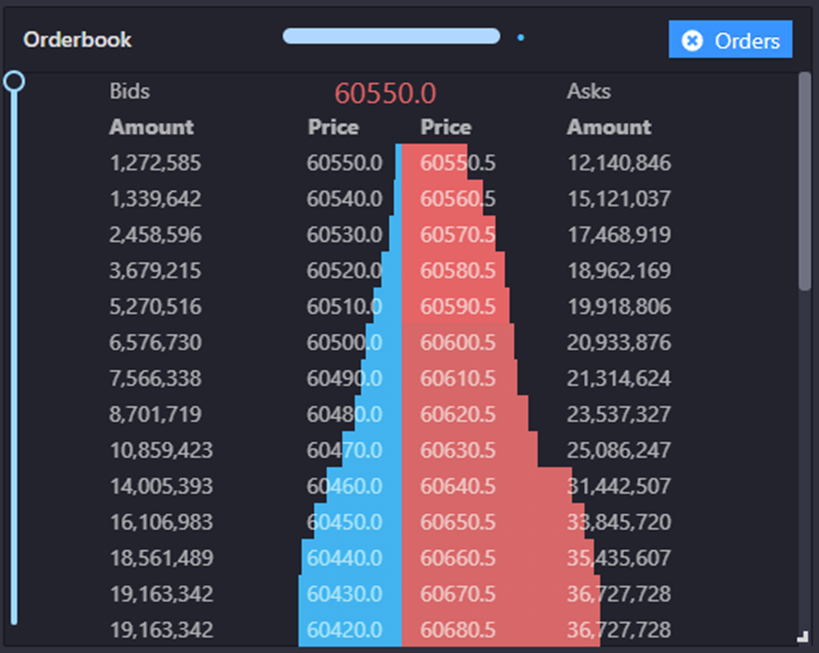
Liquidity depends on the depth of the order book – the number of buy and sell orders at different prices. For example, liquidity may remain low if an asset has a high trading volume, but all transactions occur in minor orders. Conversely, an asset with moderate volume but a dense order book will be more liquid.
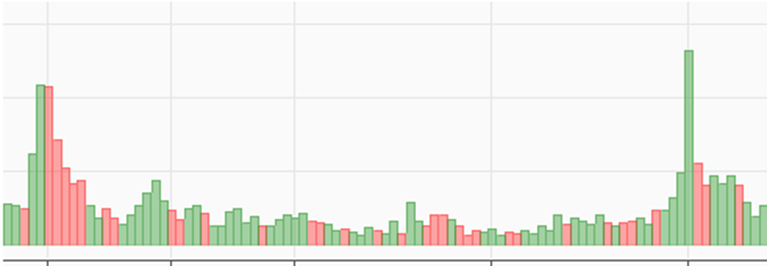
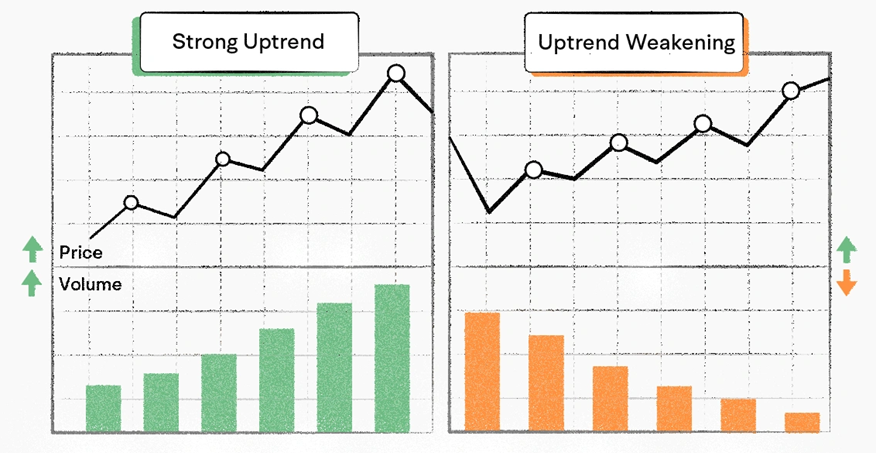
How Trading Volume Indicates Trend Strength or Possible Reversals
Analyzing trading volume helps assess the strength of the current trend.
- If a price increase or decrease is accompanied by high volume, it confirms the movement’s strength.
- A decline in volume during price changes may indicate a weakening trend.
Additionally, volume analysis can help identify potential reversals. If the price stabilizes after a prolonged price increase and trading volume decreases, it may indicate slowing activity. Near key support or resistance levels, a sharp spike in volume often signals a potential change in price direction.
Using Volume to Confirm Technical Analysis Signals
Trading volume helps confirm technical analysis signals.
Example:
If the price approaches a resistance level and breaks it with low volume, it may indicate a false breakout or weak market interest. However, if an increase in volume accompanies a breakout, it suggests active market participation and a higher probability of continued movement.
How to Interpret Trading Volume
High Volume and Its Significance
In the stock market, significant trading volume indicates active market participation and confirms the strength of an existing trend. When the price rises with high volume, it signals increased demand for the asset, making continued movement more likely. Market activity spikes during economic news releases or corporate earnings reports, increasing trading volume.
For example, investors start buying shares if a company publishes a strong financial report. At the same time, traders who anticipated the price increase may take profits and close their positions. This balances supply and demand, increasing price growth and trading volume. However, if new buyers decrease and trading volume drops, the price may enter a consolidation phase or slow its upward movement.
Low Volume and Its Significance
A declining trading volume indicates waning interest in an asset and market uncertainty. This often happens during consolidation periods when traders wait for new signals before significant price movements. In some cases, low volume may suggest the end of a trend as market activity weakens.
Example: If the market has low trading activity, order book requests remain unfilled, and the price moves within a narrow range, it indicates a sideways movement (flat). In such situations, the market awaits new participants to determine the next price direction.
Volume in the Context of Trends
Analyzing volume helps assess how strong a trend is:
- If volume increases along the trend, it confirms its strength and continuation probability.
- If the price rises while volume declines, it signals a potential reversal.
Breakouts and price level breaches: A sharp increase in volume when breaking through a support or resistance level indicates a high probability of further movement in the same direction. For example, if Bitcoin breaks a resistance level amid a significant volume increase, it confirms the strength of the bullish impulse.
Trend reversals: A weakening trend accompanied by decreasing volume may signal an impending reversal. For instance, if Ethereum continues to rise in price but trading activity declines, it may indicate a weakening bullish impulse and potential correction.
The Role of Trading Volumes in Financial Markets
Trading Volumes in Cryptocurrency Markets
Cryptocurrency trading volume reflects the total flow of funds entering and exiting the market over a specific period. This metric accounts for aggregate volumes on centralized and decentralized exchanges and is a crucial indicator for traders and investors. It represents current market activity and suggests potential price direction and future demand levels.
Volumes influence liquidity: the higher the activity, the smaller the spread between bid and ask prices. This reduces the likelihood of sharp price fluctuations. However, not all reported volumes are accurate—some exchanges artificially inflate figures to create the illusion of high liquidity. Therefore, it is essential to use data from verified platforms and consider additional metrics.
Trading Volumes in Stock Markets
In stock markets, volume reflects market participant activity and determines the level of interest in specific stocks or the market as a whole. For example, a sharp increase in volume during a stock price surge indicates a strong uptrend, whereas rising volume during a price decline signals a possible trend reversal.
Exchanges track and publish trading volume data, providing investors and analysts with valuable insights for decision-making. Analyzing volumes alongside price movements helps identify trends, confirm or refute technical analysis signals, and assess market movement strength.
Trading Volumes in Forex Markets
The decentralized nature of the Forex market means there is no single source of trading volume data. Instead, tick volume, which reflects the number of price changes over a given period, is used. Although it does not show actual monetary turnover, analyzing tick volume helps identify participant activity and predict price movements. For a more accurate assessment, traders often refer to futures market volumes.
Trading Volumes in Commodity Markets
Futures contract trading volume indicates the level of interest in commodity assets and helps forecast price changes. Increasing volumes suggest rising demand and expected volatility. Additionally, high volumes provide better liquidity, facilitating smoother buy and sell operations.
How to Use Trading Volumes in Trading Strategies
Combining Volume with Other Technical Indicators
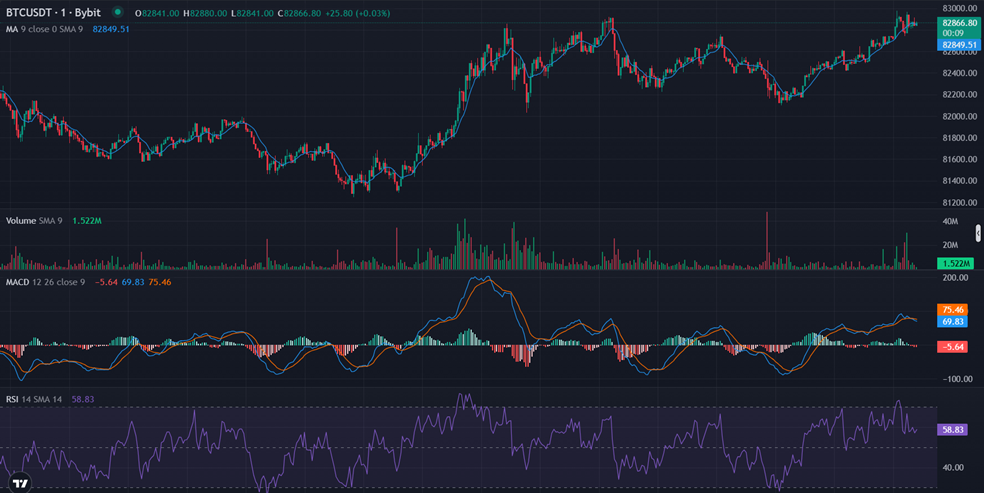
Integrating volume with technical indicators enhances signal accuracy and provides deeper market insights. Key combinations include:
- Moving Averages (MA): Moving averages smooth out price fluctuations and reveal trends. An increase in volume during a price crossover of a moving average indicates the possible start of a new trend, reinforcing its strength.
- Relative Strength Index (RSI): RSI measures price momentum, indicating overbought and oversold conditions. Volume confirmation of these states strengthens RSI signals for entering and exiting trades.
- Moving Average Convergence Divergence (MACD): MACD tracks trend strength, direction, and duration. Combining MACD with volume analysis helps identify potential reversals or confirm trend strength.
Example of Volume Analysis Using Indicators
Some indicators are specifically designed for volume analysis:
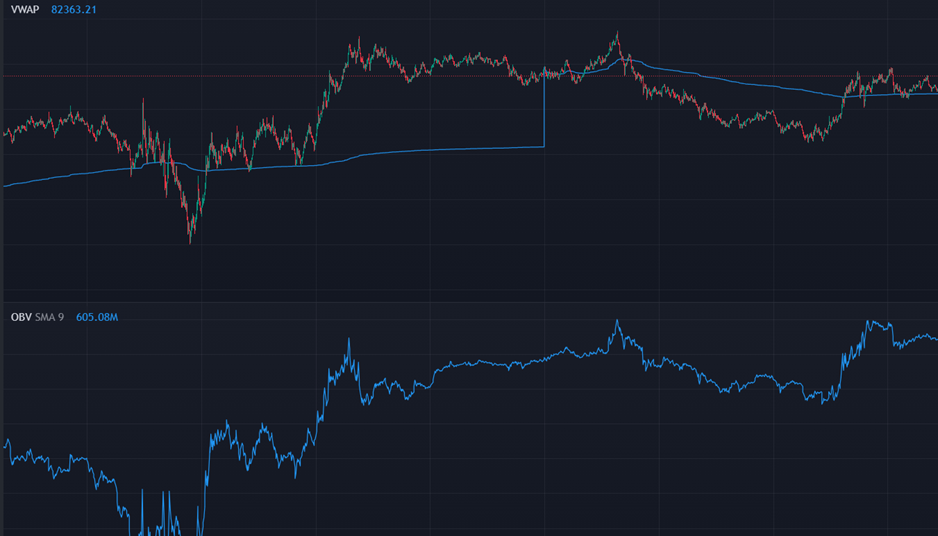
On-Balance Volume (OBV)
OBV reflects the impact of trading volume on price dynamics.
Principle of On-Balance Volume:
- The volume is added if the closing price increases compared to the previous period.
- If the closing price decreases, the volume is subtracted.
- If the price remains unchanged, OBV stays the same.
OBV helps detect hidden market signals. For example, if the price rises but volume declines, it indicates possible trend weakness and an upcoming reversal. Conversely, if the price falls but OBV remains high or increases, it suggests accumulation by large players before a potential price rise.
How to Use OBV
- Trend Confirmation: Rising price and OBV indicate a strong uptrend, while simultaneous declines confirm a downtrend.
- Divergence: If the price reaches new highs but OBV does not rise accordingly, it signals a potential trend reversal.
Volume Weighted Average Price (VWAP)
VWAP represents the ratio of an asset’s traded value to its total transaction volume during a trading session. It is the average price at which traders bought or sold the asset.
How to Interpret VWAP:
- If the price is above VWAP, the market is bullish (upward).
- If the price is below VWAP, bearish (downward) sentiment prevails.
VWAP can also act as a support or resistance level.
How to Use VWAP in Trading
- Buying Below VWAP: If the price is below VWAP, it is a favorable buying point since the asset trades cheaper than the “average” price.
- Selling Above VWAP: If the price is above VWAP, it presents a good opportunity to profit, as the asset trades higher than its average price.
Applying Volume Spread Analysis (VSA)
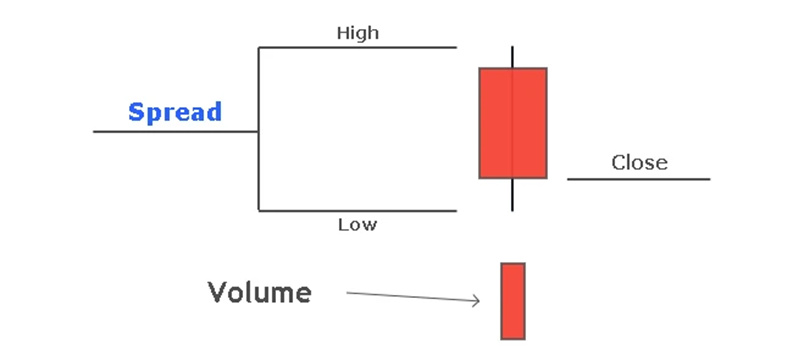
The Volume Spread Analysis (VSA) method examines the relationship between trading volume and price movement, helping traders identify trends and avoid false signals caused by market manipulations.
VSA aims to determine how volume, price movement range (spread), and closing price correlate to understand the supply-demand balance. This approach helps detect potential reversal points and confirm existing trends.
VSA Principles
-
Analyzing Spread and Volume
- A widespread high volume indicates strong participation by major players, signaling trend continuation or reversal.
- A narrow spread with low volume suggests weak interest in the asset and possible consolidation before a sharp movement.
- High volume with minimal price change indicates a support or resistance level where supply and demand are balanced, preventing significant price movement.
-
Identifying Strong and Weak Market Movements
- Rising prices on high volume confirm a bullish trend.
- High volume with little price change may indicate a trend weakening and a potential reversal.
- Falling prices on increasing volume suggest a bearish trend.
-
Distinguishing Genuine and False Moves
- Market Manipulations: Large players can artificially push prices up or down, creating an illusion of a trend. VSA helps identify such manipulations by spotting discrepancies between volume and price movement.
- Buying Climax: A sharp price surge on extremely high volume may indicate the trend’s end as major players exit positions.
- Selling Climax: A steep price drop on high volume often precedes an upward reversal.
Common Mistakes in Volume Analysis
Typical Errors and Misconceptions
- Ignoring Market Context: Volume should be analyzed in conjunction with market conditions. For example, volume growth in a consolidation phase has a different meaning than in a clear trend.
- Overemphasizing Short-Term Volumes: In low-liquidity or highly volatile conditions, sudden volume spikes may produce false signals, especially on short timeframes.
- Underestimating External Factors: Economic reports, corporate events, and other fundamentals can significantly impact trading volumes. Ignoring them leads to incorrect conclusions.
- Using Volume Without Additional Indicators: Solely relying on volume analysis without other tools (such as moving averages or MACD) results in misleading market assessments.
How to Avoid False Signals and Improve Analysis Accuracy
- Consider Context: When analyzing volumes, factor in the trend, market phase, and current volatility to interpret volume changes correctly.
- Examine Volumes Across Multiple Timeframes: Comparing short- and long-term volumes helps identify overarching trends and filter out random fluctuations.
- Monitor External Factors: Economic reports, corporate news, and other events can explain sudden volume changes and prevent misinterpretations.
- Combine Volumes with Other Indicators: Using volume analysis alongside tools like moving averages or MACD enhances the reliability of trading signals.
- Practice and Learn: Consistent analysis and studying technical analysis materials help develop intuition and avoid common mistakes.
Conclusion
Trading volume analysis provides deeper insights into market activity, confirming trends, identifying potential reversals, and reducing false signals. However, effective use requires understanding the broader market context, combining volume analysis with other indicators, and gaining practical experience. Traders who accurately interpret volumes gain a significant advantage, improving decision-making quality and forecast precision.