What is Used Leverage and How to Analyze Strategy Risks?
At TradeLink Passport, we strive to provide the most comprehensive statistics for each connected exchange account. Our goal is transparency, allowing users to make informed decisions about trading strategies based on available data.
One of the key indicators for assessing strategy risks is Used Leverage. Today, we’ll dive deeper into what it is, why it’s important, its limitations, and how to use it for strategy analysis.
Contents
- What is Used Leverage?
- Limitations of Used Leverage
- How to Use Used Leverage?
- What Does a High Used Leverage Value in Both Directions Indicate?
- Conclusion
What is Used Leverage?
Used Leverage is a unique indicator on the TradeLink Passport platform, designed to analyze position load on a deposit at any historical point in time.
Simply put, it shows the volume of open positions relative to the available deposit on the account.
How is Used Leverage calculated?
We sum up the volume of open positions in each direction at a given moment, add the results together, and divide by the current deposit volume:
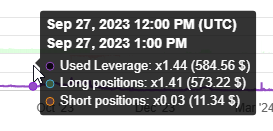
Used Leverage = (Long Positions + Short Positions) / Margin Balance
Additionally, the Used Leverage chart displays two related metrics:
- Volume of long positions
- Volume of short positions
- Their ratio relative to the deposit
Limitations of Used Leverage
Like most indicators on the platform, Used Leverage is calculated with hourly accuracy. This means that if a strategy opened and closed a large position within an hour, it won’t appear on the Used Leverage chart.
To avoid displaying irrelevant information, we exclude values below 0.1% of the deposit. This prevents small amounts (e.g., $0.2 left on a Bybit UTA spot account) from distorting the indicator.
By default, the Used Leverage chart matches the accuracy of other portfolio indicators. For example, on a daily chart, it aggregates data once per day, which might not be detailed enough for analyzing short-term strategy behavior. To increase accuracy, switch to the hourly chart, which provides 24 times more data points.
How to Use Used Leverage?
Let’s analyze some real strategy examples using profitability charts and Used Leverage data.
Example 1: A Strategy Using Position Averaging
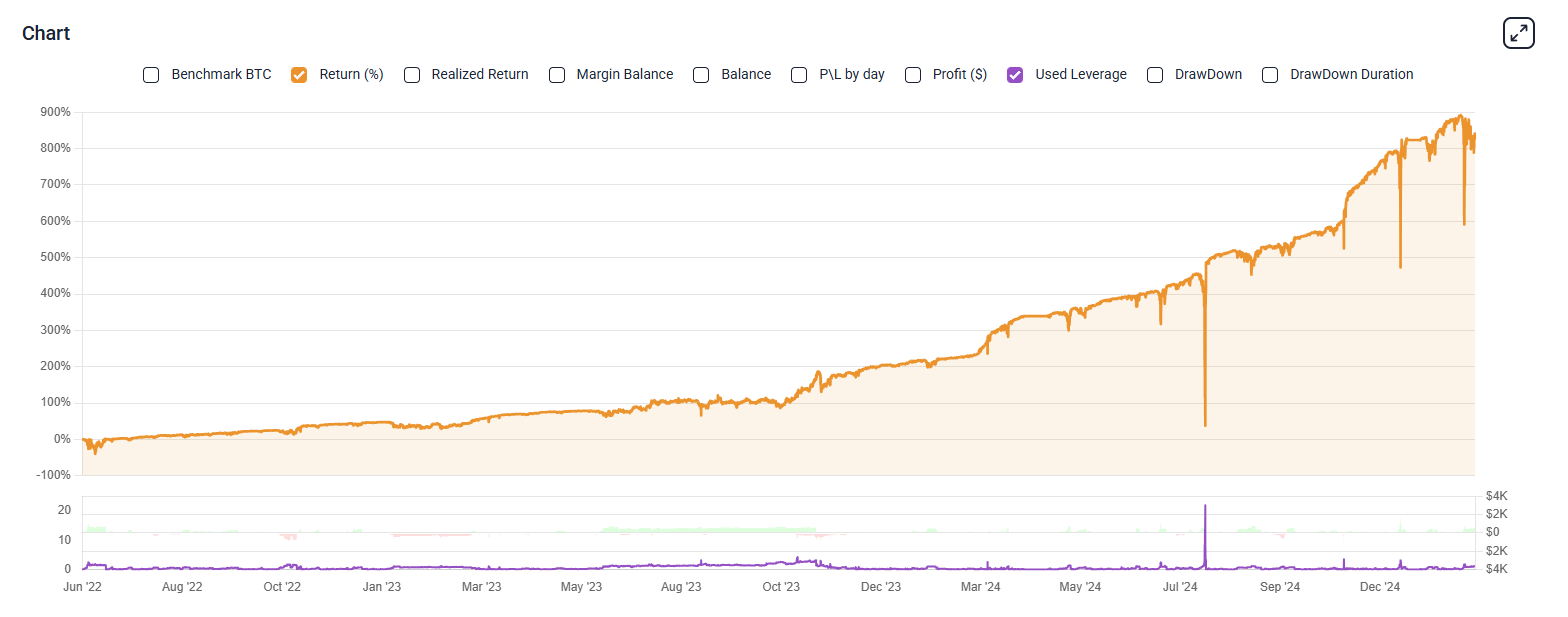
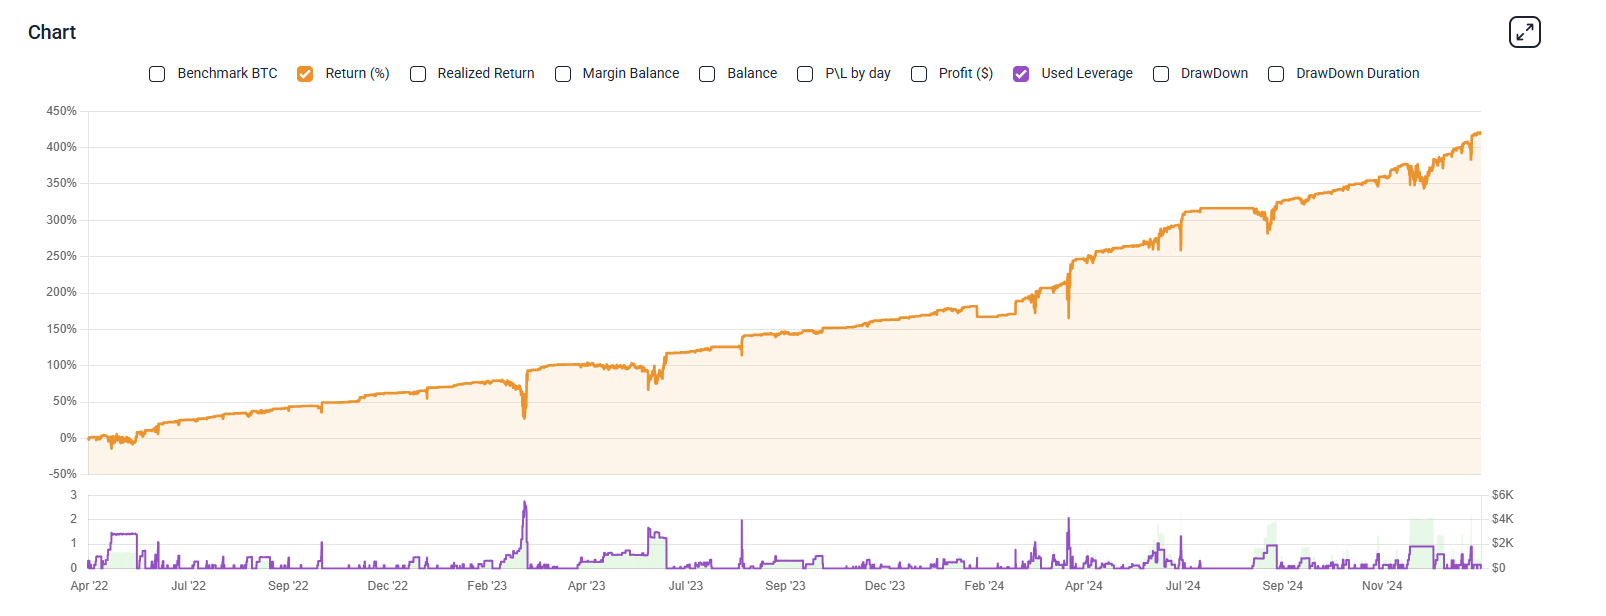
In the attached image, you can see two charts:
- Unrealized Profit (%) (orange, top)
- Used Leverage (purple, bottom)
Looking at the Used Leverage chart, we can immediately see that the strategy **opens positions in both directions **— this is evident from the green and red bars, which represent the total volume of positions in each direction.
One clear highlight is a spike in Used Leverage in July 2024, where the ratio of open positions to deposit reached 20x!
This suggests that the strategy employs position averaging:
If the market moves against the strategy’s expectations, it adds to its position until it recovers losses. The absence of similar spikes in December 2024 suggests that positions were opened and closed too quickly to be captured in hourly data. However, since the drawdown and recovery pattern remains the same, we can infer that the strategy’s logic hasn’t changed — it still averages down during drawdowns.
Example 2: A Strategy Trading Only Long Positions
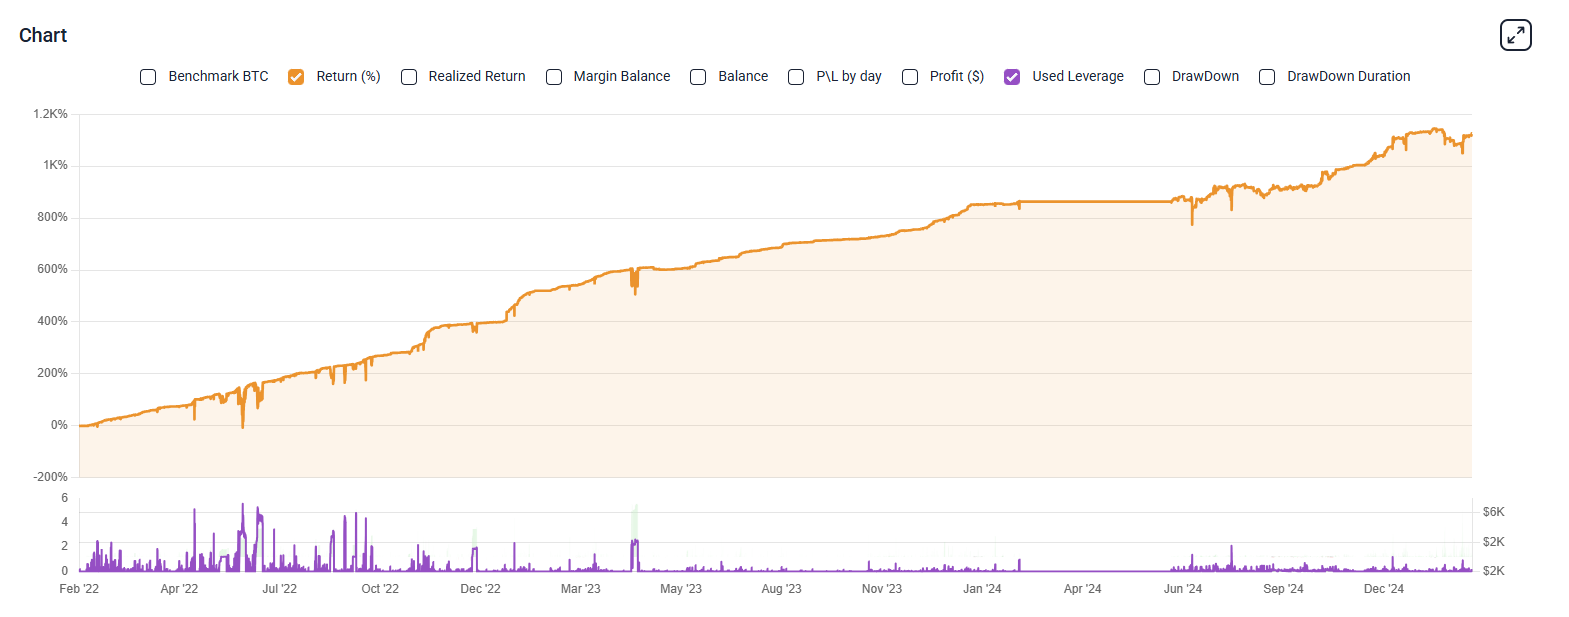
Looking at another chart, we can immediately conclude that the strategy only trades long positions and primarily holds short-term trades.
From May 2023 to April 2024, there are no long-duration trades on the Used Leverage chart. However, the profit chart still trends upward, confirming a successful long-only strategy. In contrast, at the beginning and end of the track, we see periods of higher trading activity, with more frequent and longer trades.
Example 3: A Strategy Trading Only Long Positions
This portfolio clearly shows a strategy that:
- Trades only long positions
- Uses position averaging
- Does not hedge positions (“locking”)
What Does a High Used Leverage Value in Both Directions Indicate?
If Used Leverage reaches a new baseline level, with equal position volumes in both directions, this could indicate a hedging (“lock”) strategy — where a trader holds a long and a short position of the same size on the same asset simultaneously.
Some traders consider this approach risky, as it depends on exchange mechanics and auto-deleveraging risks.
While Used Leverage doesn’t take a stance on this, it helps identify such events when they occur.
Conclusion
Used Leverage is an essential indicator for strategy analysis. It helps uncover trading mechanics that might be difficult to spot using other charts.
By analyzing Used Leverage, you can better understand the risks of your strategy, its strengths, and weaknesses. The visual representation of deposit load vs. profitability makes it easier to evaluate potential returns and adjust accordingly.
You can explore more public strategies with Used Leverage charts on any portfolio page in the traders’ rating. The leaderboard is open to all users on the internet, so feel free to dive in and analyze real strategies today!