How to Spot an Overbought or Oversold Market
Contents
- Introduction
- What Are Overbought and Oversold Market Conditions
- Key Indicators for Identifying Overbought and Oversold Conditions
- What Influences Overbought and Oversold Conditions
- Examples of Overbought and Oversold Markets
- How to Act in Overbought and Oversold Markets
- Conclusion
Introduction
Why It’s Important to Understand Market Conditions in Trading and Investing
To trade or invest successfully, it’s crucial to understand the overall state of the market. The market doesn’t always move steadily: sometimes prices rise too quickly, driven by intense euphoria, while at other times sharp declines trigger widespread panic. It’s essential to recognise when the market is overheated and when it’s under pressure due to fear. This helps avoid buying at peaks and selling at lows. The ability to assess market sentiment and dynamics enables better capital protection and more informed decision-making.
A Brief Overview of “Overbought” and “Oversold” Conditions
There are two key market conditions every trader and investor should be aware of: overbought and oversold. These conditions don’t predict the exact direction of price movements but can signal a higher probability of a reversal. An overbought market occurs when demand is excessively high, causing prices to rise faster than the underlying fundamentals would justify. An oversold market, on the other hand, appears during periods of panic and excessive selling pressure. Recognising these conditions helps avoid impulsive decisions, provides opportunities to lock in profits, and can highlight favourable moments to open new positions.
What Are Overbought and Oversold Market Conditions
Definitions: What each term means
- Overbought is a condition where an asset’s price has climbed too high, too quickly. This often happens after a strong rally without any pullbacks. At this point, most traders have already bought in, and there may be few buyers left, increasing the risk of a downturn.
- Oversold is the opposite. The asset’s price has dropped significantly, and the market is under heavy selling pressure. This also creates a risk of reversal, only to the upside. Such conditions are often seen as opportunities to buy at a discount.
The difference between the two and their impact on the market
The primary difference lies in the direction of the price. Overbought signals upward overheating, while oversold indicates downward overheating. But both conditions suggest the market may pause or reverse. It’s not a guaranteed turnaround — instead, a warning sign. These moments help traders avoid emotional decisions and approach the market more rationally.
Key Indicators for Identifying Overbought and Oversold Conditions
Technical indicators
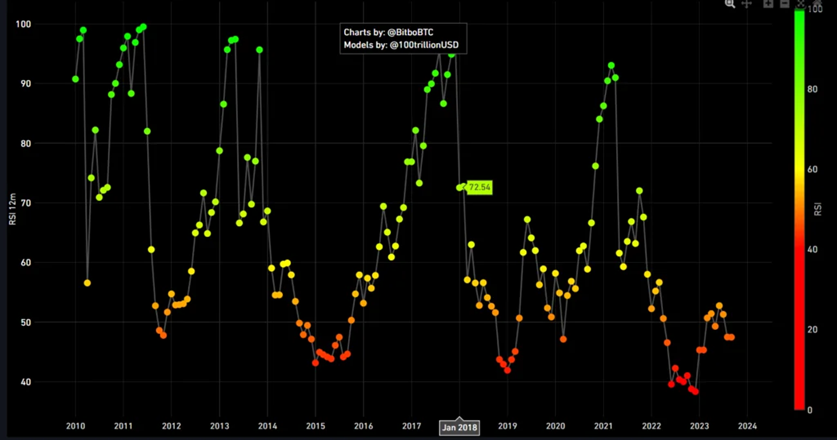
Relative Strength Index (RSI): How to use it to evaluate market extremes
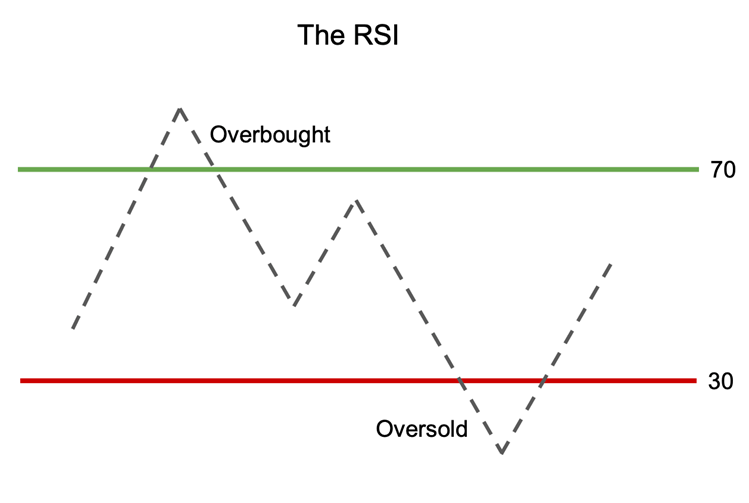
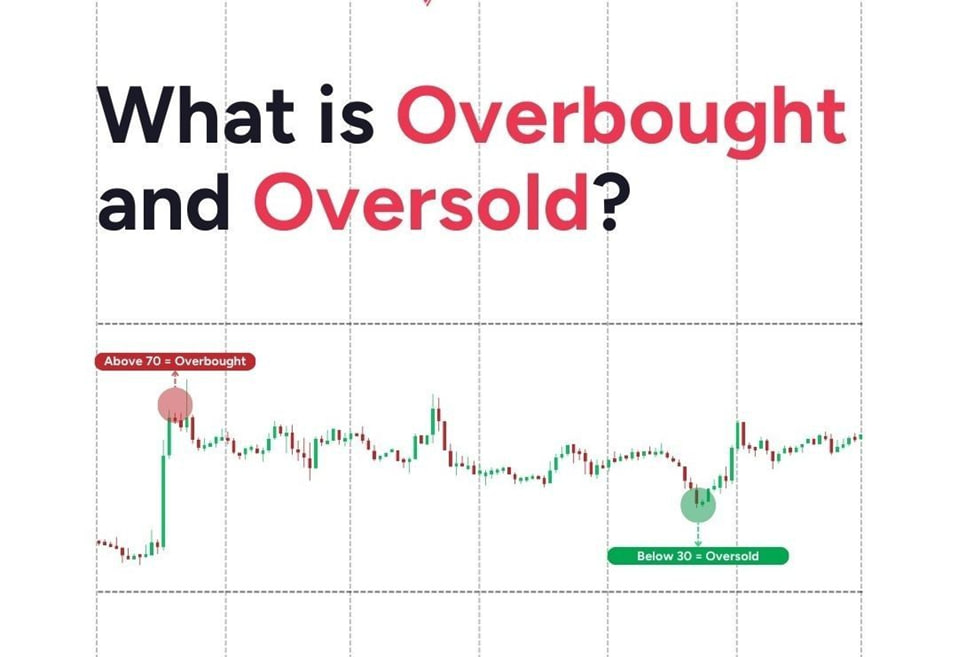
The RSI is a popular tool that measures the recent and significant price changes. It’s measured on a scale from 0 to 100. When RSI rises above 70, the market may be overbought; if it falls below 30, it is oversold. However, it should be used with caution. RSI alone doesn’t provide exact signals — it simply prompts traders to pay closer attention to the market.
Stochastic Oscillator: How it works and how to interpret it
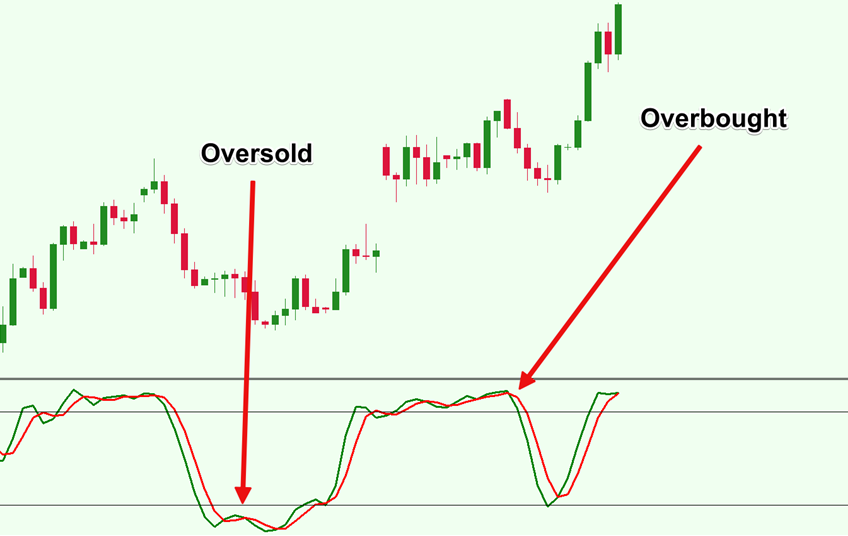
This indicator compares the current price to its past values over a set period. It also ranges from 0 to 100. When the lines rise above 80, the market may be overbought. When they drop below 20, they are considered oversold. Traders use this oscillator to identify entry and exit points, but it can be misleading during strong trends. That’s why it’s essential to analyse price action in conjunction with the indicator.
Bollinger Bands: How to analyse deviations from normal levels
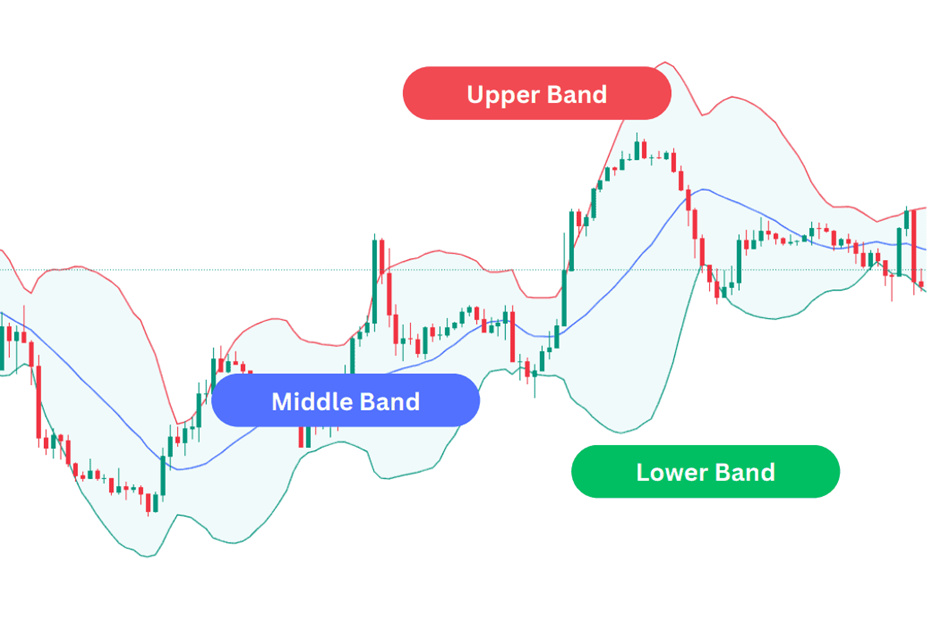
Bollinger Bands consist of three lines centred around a moving average. The upper and lower bands represent boundaries of normal price movement. When price suddenly moves beyond these bands, it may indicate an overbought or oversold market. If the price stays above the upper band for too long, the market might be overheating. If it remains below the lower band, it may be oversold. But a single breakout isn’t enough — it’s essential to consider the overall context and trading volume.
Volume indicators
The role of trading volume in identifying overbought/oversold conditions
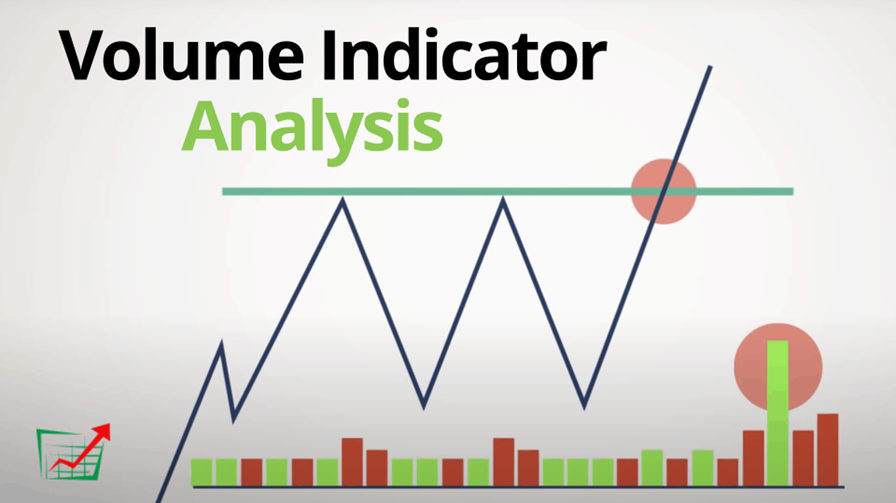
Volume indicates the number of people buying and selling an asset. If price rises rapidly while volume declines, it may signal weak interest, often a sign of overbought conditions. Conversely, if price drops but volume is low, the market might be oversold. Volume helps reveal the strength behind a move. If both volume and price increase together, the trend may be strong. But if volume fades, a reversal could be near.
Moving averages: How they help assess market conditions
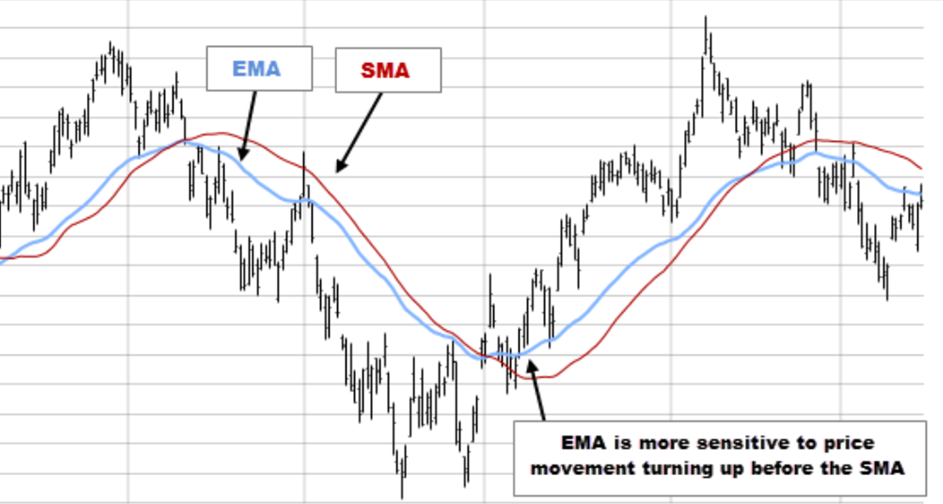
Moving averages, such as the Simple Moving Average (SMA) and the Exponential Moving Average (EMA), smooth out prices over time and are commonly used to evaluate trend direction. If the price remains significantly above the average and drifts far from it, the market may be overbought; conversely, if the price is substantially below the average, it may be oversold. Moving averages are most effective in calm, trending markets. They help identify when the price may have deviated too far from the norm.
What Influences Overbought and Oversold Conditions
Changes in supply and demand
When demand surges, prices rise quickly, often leading to an overbought market. Investors rush to buy before prices climb further. Meanwhile, supply shrinks as current holders hesitate to sell, causing the price to skyrocket.
The opposite also occurs — when sellers flood the market, supply increases and demand weakens. Prices drop sharply, creating oversold conditions. These movements are sometimes short-lived, especially if real issues don’t back up panic.
Market psychology and crowd behaviour
Crowds often act on emotion. Fear and greed can greatly influence prices. When everyone is buying, it’s tempting to join in — even if the opportunity has passed. This drives prices even higher, leading to overbought conditions.
The same applies during sell-offs. As prices fall, many panic-sell, regardless of the underlying reasons. This triggers steep drops, creating oversold markets.
It’s essential to remember that the crowd rarely buys or sells at the right time. A trader should remain calm and focus on facts, rather than emotions.
Economic news and its effect on investor sentiment
News can dramatically shift market sentiment. Positive earnings reports, economic growth, or lower interest rates can trigger buying sprees, pushing markets into overbought territory.
Negative headlines, such as poor data, crisis rumours, or rate hikes, can spark panic selling, leading to oversold conditions.
Markets often overreact to news. Investors sometimes overvalue the importance of events, resulting in price increases where they are unwarranted. It’s critical to analyse both the headline and its real impact.
Examples of Overbought and Oversold Markets
Historical examples from financial markets
A clear example of overbought conditions was Bitcoin in January 2018, when its Relative Strength Index (RSI) reached a value of 72. The market was fueled by hype, with many buying out of fear of missing out. Shortly afterwards, Bitcoin’s price began a steep decline.
An example of oversold conditions occurred with Ethereum in May 2021, when the stochastic oscillator reached a reading of 85. Despite strong buying interest, intense selling pressure triggered a sharp correction.
How market behaviour changes under these conditions
In overbought markets, participants begin to doubt further growth. Many take profits, leading to a correction or reversal, increasing selling pressure.
In oversold markets, institutional buyers often step in. They see discounted prices and start accumulating. This leads to a gradual recovery.
These moments are ideal for analysis, helping traders identify potential opportunities. The key is to remain patient and consider the broader perspective.
How to Act in Overbought and Oversold Markets
Risks of trading in such market conditions
When the market is overbought or oversold, prices often move outside standard patterns, making behaviour less predictable. Trading in these moments can be profitable, but it also carries a higher risk.
In an overbought market, the asset appears overpriced. Traders may expect a pullback, but prices could still rise before reversing, leading to losses for early short positions.
In an oversold market, prices seem too low, yet they can fall further. Buying without confirmation can result in failed trades.
The primary danger is attempting to predict a reversal too soon. Many traders rush in without waiting for solid signals.
Trading strategies when identifying overbought or oversold markets
In overbought markets, consider short positions only after signs of weakness, such as price breaking a key support level after substantial gains.
In oversold markets, look for buying opportunities, but wait for reversal signals — like a strong bullish candle or price rising after a prolonged downtrend.
A solid strategy includes confirmation from multiple sources, such as indicator signals, price reactions to levels, and changes in volume. Acting on a single signal can lead to errors.
How to use indicator signals to make decisions
Indicators such as the RSI or stochastic oscillator help identify when an asset is overbought or oversold. If the RSI rises above 70, it may signal overbought conditions; if it falls below 30, it indicates oversold conditions.
But numbers alone aren’t enough. These tools show market state, not exact turning points. Combine them with chart patterns. For example, if the RSI indicates an overbought condition and bearish candles begin to form, it may be time to consider selling.
Volume also matters. In overbought markets, a decline in volume can signal that momentum is weakening. In oversold markets, an increase in buying volumes suggests that accumulation has begun.
Conclusion
Overbought and oversold conditions aren’t just numbers on a chart — they reflect market imbalance. Trading during these periods is possible, but requires caution.
The key is patience, along with confirmation from price action and volume. It’s better to miss a trade than to lose money by acting too quickly. A trader who knows how to wait will always have the edge.